Collect and Analyze the Diagnostic Information
- 2 minutes to read
XAF applications support collecting diagnostic information using common approaches applicable to any .NET applications. This topic lists Visual Studio settings required to collect error information and describes how to analyze this information.
Adjust Visual Studio Settings
Before debugging an error, modify the following Visual Studio settings:
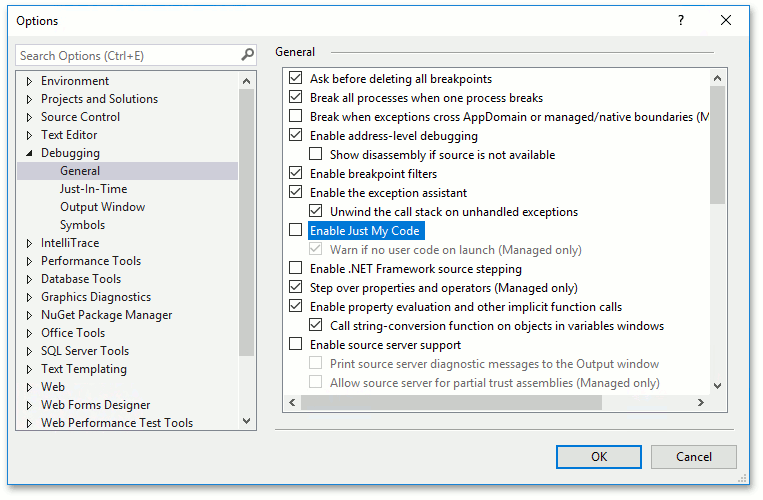
Click Tools | Options… to invoke the Options dialog. In the left-hand panel, choose the Debugging | General category and disable the Just My Code option.
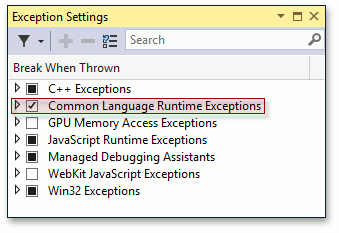
If you use Visual Studio 2015 or newer, enable Common Language Runtime Exceptions in the Exception Settings window. If this window is hidden, click Debug | Windows | Exception Settings in Visual Studio’s menu (see Managing Exceptions with the Debugger).
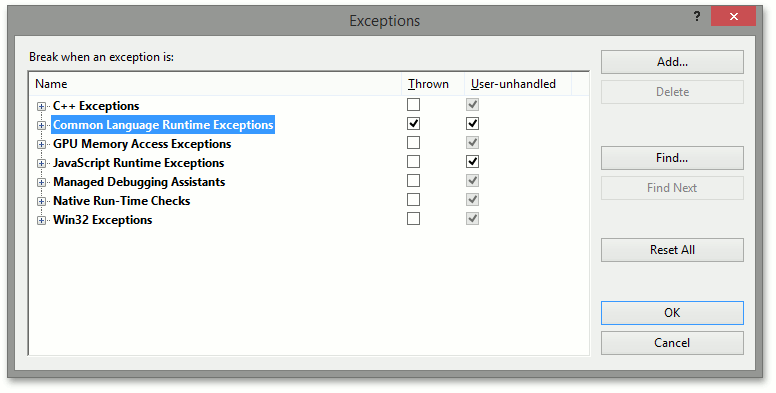
If you use Visual Studio 2013 or earlier, click Debug | Exceptions… in the menu and enable Common Language Runtime Exceptions in the invoked Exceptions window (see How to: Break When an Exception is Thrown).
Analyze the Diagnostic Information
You can now run your application and reproduce the error. Open the Call Stack window and view the routines that are currently in the stack.
- If the routines at the top of the call stack refer to .NET Framework or third-party libraries, you can search for the error message and call stack text in public community resources like Stack Overflow, where possible solutions may already be discussed.
- If there are DevExpress routines at the top of the call stack, contact the DevExpress support team. Attach your project, the eXpressAppFramework.log file, the full exception call stack and inner exceptions info to the support ticket. If the error relates to your database content, attach a backup of the database as well.