How to: Display a List View as a Chart
- 6 minutes to read
The default List Editors used to visualize Views in XAF applications are GridListEditor and ASPxGridListEditor (used in WinForms and ASP.NET applications, respectively). These default List Editors visualize List Views as grids. This topic demonstrates how to visualize a List View as a chart, using capabilities provided by the Chart Module. The List View, visualized by the ChartListEditor and ASPxChartListEditor List Editors will be defined in the Application Model. Customizations of the Chart settings using the Chart Designer will also be demonstrated.
Tip
A complete sample project is available in the DevExpress Code Examples database at https://supportcenter.devexpress.com/ticket/details/e2840/how-to-display-a-list-view-as-a-chart.
The implementation of the sample application demonstrating the use of Chart List Editors is comprised of the following stages.
- Implement Sample Persistent Object
- Create a New List View Node
- Create the Navigation Item for the Chart List View
- Add the Chart Module
- Change the List View’s List Editor
- Specify Chart Settings
- Run the Application
Tip
You can see examples with Chart List Editors in the FeatureCenter and XCRM demos shipped with XAF. These demos are located in the %PUBLIC%\Documents\DevExpress Demos 19.1\Components\eXpressApp Framework folder, by default.
Implement Sample Persistent Object
Let us consider the following Employee persistent class or same Entity Framework class.
using DevExpress.Persistent.Base;
using DevExpress.Persistent.BaseImpl;
using DevExpress.Xpo;
using System.ComponentModel;
//...
[DefaultClassOptions, DefaultProperty("FullName"), ImageName("BO_Person")]
public class Employee : BaseObject {
    public Employee(Session session) : base(session) {}
    private string firstName;
    private string lastName;
    private string position;
    [VisibleInListView(false)]
    public string FirstName {
        get { return firstName; }
        set { SetPropertyValue("FirstName", ref firstName, value); }
    }
    [VisibleInListView(false)]
    public string LastName {
        get { return lastName; }
        set { SetPropertyValue("LastName", ref lastName, value); }
    }
    [VisibleInDetailView(false)]
    public string FullName {
        get { return String.Format("{0} {1}", FirstName, LastName); }
    }
    public string Position {
        get { return position; }
        set { SetPropertyValue("Position", ref position, value); }
    }
}
Note
Although the Employee is an XPO persistent class, the approach demonstrated here can be used with Entity Framework too.
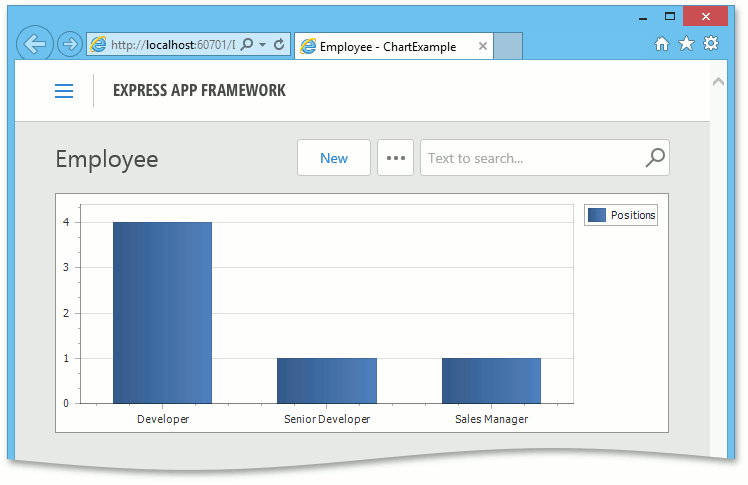
In this example, we will create the Employee chart, which can be used to compare quantities of Employees with different Positions.
Create a New List View Node
Follow the steps below to create a List View node, which defines a List View to be visualized by a Chart List Editor.
- Invoke the Model Editor for the platform-agnostic module project.
Navigate to the Views | Employee_ListView node, which is auto-generated for the Employee persistent object. Right-click it and select Clone.
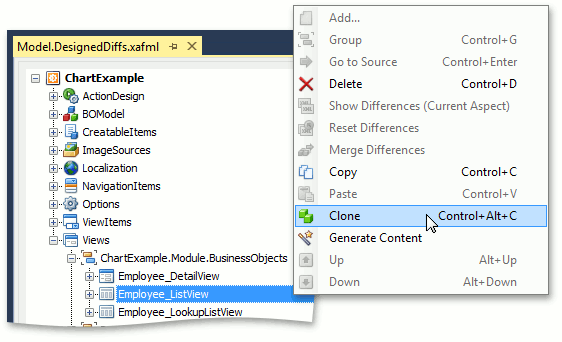
A copy of the List View node will be created.
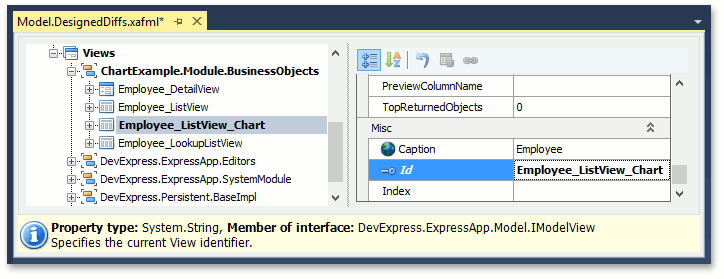
Change the new node’s IModelView.Id property to “Employee_ListView_Chart”.
Create the Navigation Item for the Chart List View
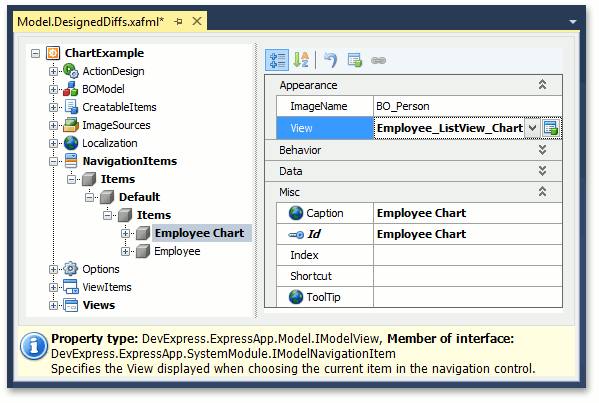
The Employee_ListView_Chart List View created at the previous stage, should be accessible by end-users. So, create the Employee Chart Navigation Item, which has the IModelNavigationItem.View property set to “Employee_ListView_Chart”.
The creation of Navigation Items is detailed in the Add an Item to the Navigation Control tutorial.
Note
Alternatively, you can define a View Variant pointing to the Employee_ListView_Chart List View. End-users will be able to choose whether to display the Employee List View as a grid or as a chart. The Provide Several View Variants for End-Users tutorial illustrates how to accomplish this task. The chart List View can also be used as a Dashboard Item (see How to: Display Several Views Side-by-Side).
Add the Chart Module
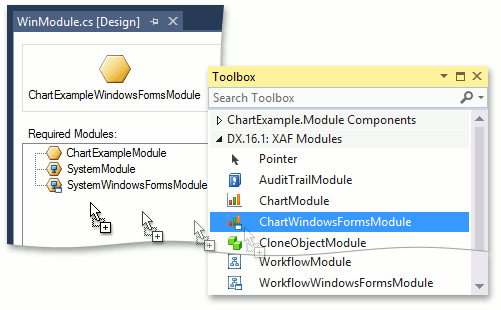
Chart List Editors are provided by the Chart Module. As this module is represented by two platform-specific module projects, you should add them separately to your application’s WinForms and ASP.NET modules.
Invoke the Module Designer for the WinForms module project. Drag the ChartWindowsFormsModule item from the Toolbox to the Required Modules panel.
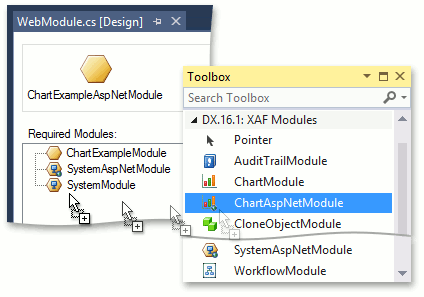
Invoke the Module Designer for the ASP.NET module project. Drag the ChartAspNetModule item from the Toolbox to the Required Modules panel.
Change the List View’s List Editor
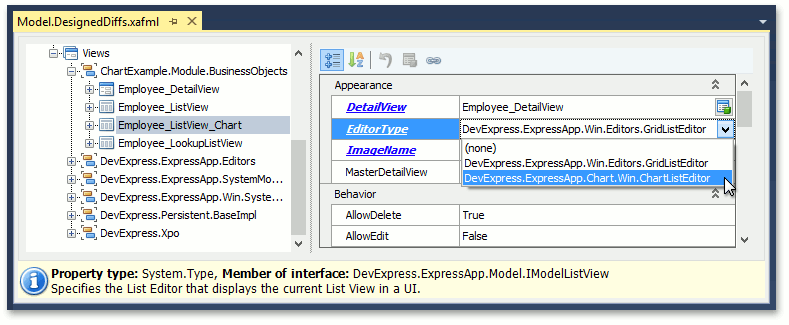
After the Chart Module is added, the Chart List Editor can be specified using the List View node’s IModelListView.EditorType property. As there are two platform-specific Chart List Editors, you should change settings separately for the WinForms and ASP.NET module projects.
Invoke the Model Editor for the WinForms module project. Navigate to the Views | Employee_ListView_Chart node. In the EditorType property’s drop-down, select “DevExpress.ExpressApp.Chart.Win.ChartListEditor”.
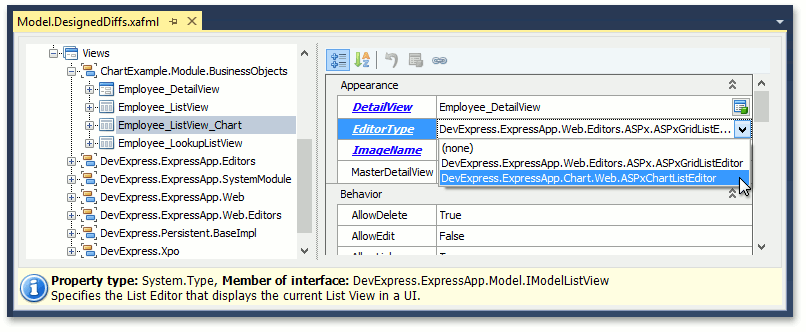
Invoke the Model Editor for the ASP.NET module project. Navigate to the Views | Employee_ListView_Chart node. In the EditorType property’s drop-down, select “DevExpress.ExpressApp.Chart.Web.ASPxChartListEditor”.
Specify Chart Settings
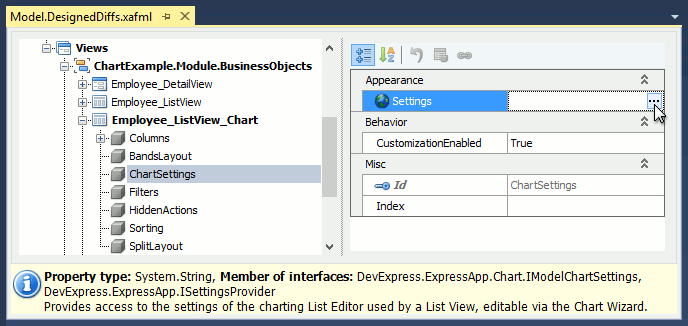
The Chart Module extends List View nodes with the ChartSettings (IModelChartSettings) child node. To specify chart settings for the WinForms application, invoke the Model Editor for the WinForms module project and perform the following steps.
Navigate to the Views | Employee_ListView_Chart | ChartSettings node. Click the ellipsis button to the right of the IModelChartSettings.Settings property value.
The Chart Designer form will be invoked. By default, main chart Options page with appearance, behavior and border settings is shown.
Click the Add Chart Element (
 ) button in the top left corner, choose “Series…” element and the Bar view type in the invoked window.
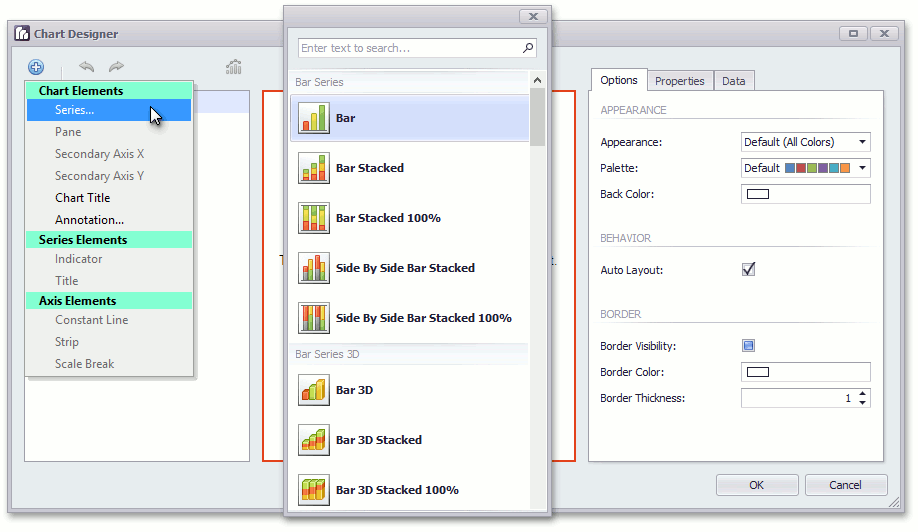
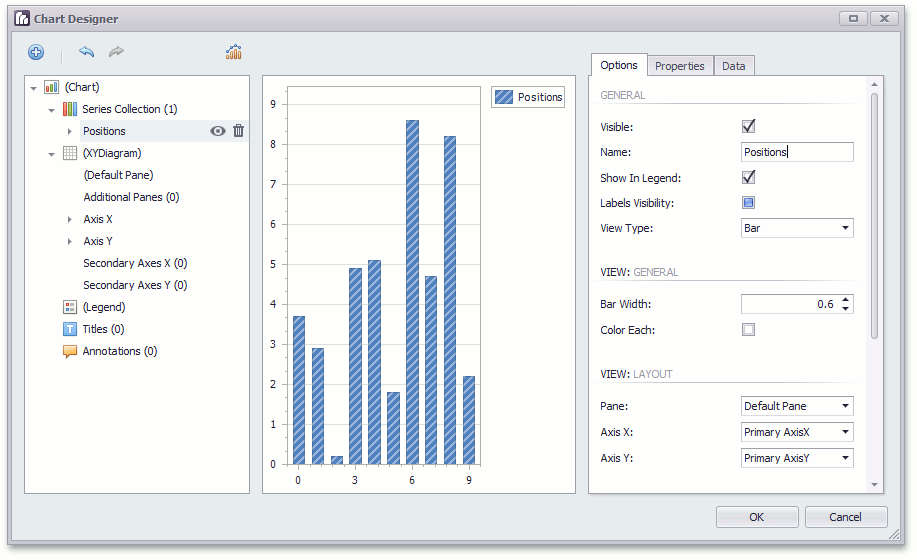
Set the new series Name property to “Positions”.
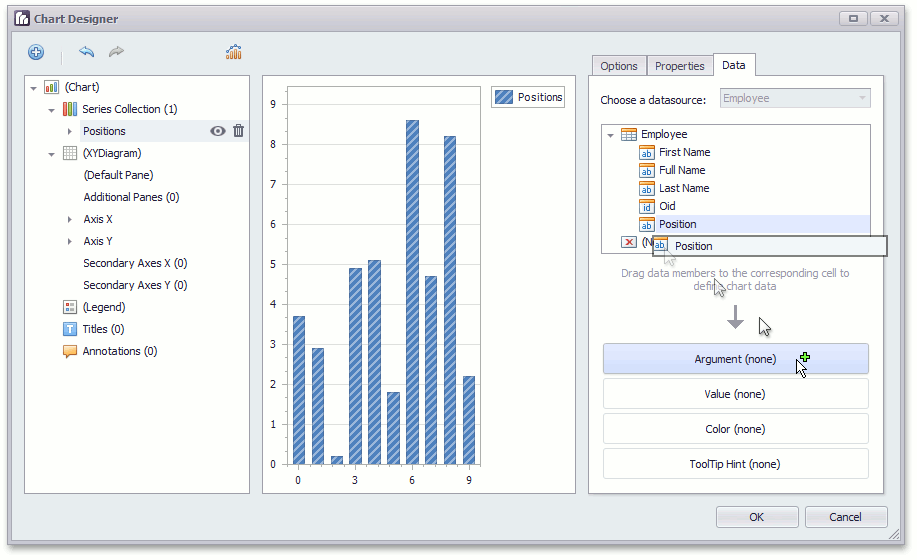
Switch to the Data tab. To define chart data, drag the Position data member to the Argument cell.
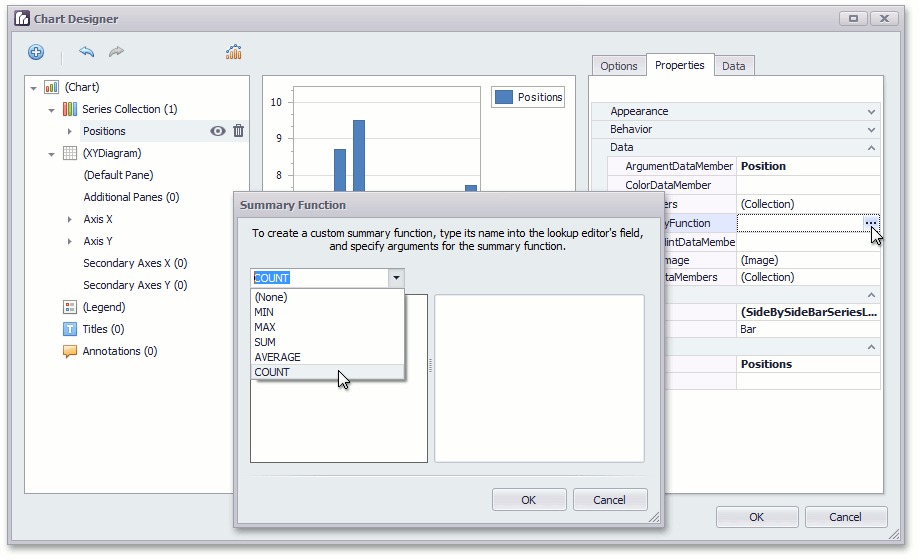
Switch to the Properties tab. In the Data group, find the Summary Function property and click the ellipsis button on the right. In the invoked window, choose Count and click OK.
- Click OK to close the Chart Designer. The chart settings in XML format will be set to the Settings property in the Model Editor.
Note
End-users can invoke the Chart Designer at run-time by right-clicking a chart and selecting Invoke Wizard. You can turn this feature off by setting the ChartSettings node’s ICustomizationEnabledProvider.CustomizationEnabled property to False. To learn about the Chart Designer capabilities in detail, refer to the Chart Designer help topic.
To specify chart settings for the ASP.NET application, invoke the Model Editor for the ASP.NET module project and perform the same steps. Note that there are two additional ChartSettings node’s properties available for the ASP.NET application - IModelWebChartSettings.PreferredWidth and IModelWebChartSettings.PreferredHeight. The PreferredWidth property specifies the minimal possible width of a chart in pixels (chart control adjusts its width automatically to fit available space). The PreferredHeight property specifies the exact height.
Run the Application
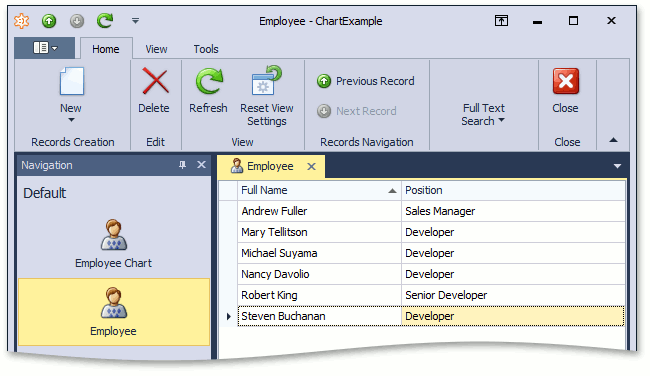
Run the WinForms application. Create several Employee objects with different positions to provide data for the chart.
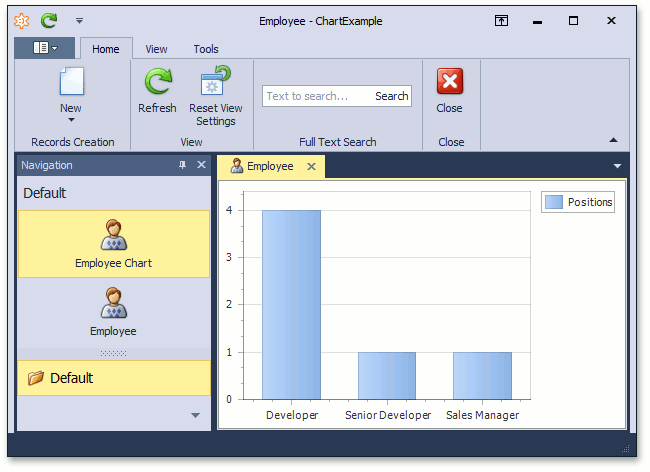
Select the Employee Chart navigation item. The chart will be displayed.
Run the ASP.NET application and check that the Employee Chart is also available.