Chart Module
- 7 minutes to read
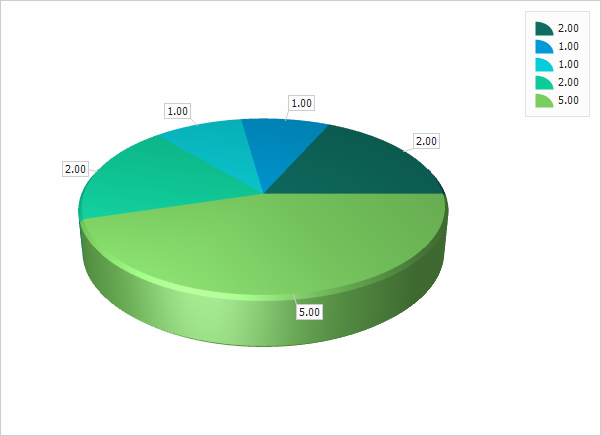
The Chart module contains List Editors that allow you to visualize data using the XtraCharts library from DevExpress. The XtraCharts library is designed for WinForms and ASP.NET Web Forms, and offers you a comprehensive set of 2D and 3D charts to address a broad range of business needs with ease. The Chart module adopts these controls for XAF applications, so you can easily visualize your data. This topic describes the basics of the Chart module.
Note
Until the Chart Module supports Blazor UI, it is possible to integrate the Blazor Chart control into your Blazor application manually. The following topic describes how to do this: Blazor - How to support the XAF Chart Module scenarios (display charts or graphs).

The Chart module is represented by three module projects.
-
Contains base classes and interfaces that are used by both the WinForms and ASP.NET Web Forms charts in XAF.
You can add this module to your platform-agnostic module. To do this, invoke the Module Designer and drag ChartModule from the Toolbox to the RequiredModules panel. Be sure to rebuild your solution after making changes in the Designer. As a result, the ChartSettings node will be added to each ListView node in the Application Model.
-
Adds references to the DevExpress.ExpressApp.Chart.v23.2.dll and DevExpress.ExpressApp.Chart.Win.v23.2.dll assemblies.
You can add this module to your WinForms module. To do this, invoke the Module Designer and drag ChartWindowsFormsModule from the Toolbox to the RequiredModules panel. Alternatively, you can add this module to the WinForms application project. To do this, invoke the Application Designer and drag the ChartWindowsFormsModule from the Toolbox to the Modules panel. Remember to rebuild your solution after making changes in the Designer. As a result, it will be possible to select the WinForms-specific Chart List Editor as the IModelListView.EditorType value in the Application Model.
-
Adds references to the DevExpress.ExpressApp.Chart.v23.2.dll and DevExpress.ExpressApp.Chart.Web.v23.2.dll assemblies.
You can add this module to the ASP.NET Web Forms application project. To do this, invoke the Application Designer and drag the ChartAspNetModule from the Toolbox to the Modules panel. Alternatively, you can add this module to your ASP.NET Web Forms module. To do this, invoke the Module Designer and drag the ChartAspNetModule from the Toolbox to the RequiredModules panel. Remember to rebuild your solution after making changes in the Designer. As a result, it will be possible to choose the ASP.NET Web Forms-specific Chart List Editor as the IModelListView.EditorType value in the Application Model.
Note
You can add modules to your application when you use the Solution Wizard to create a new XAF solution. Select modules in the Choose Additional Modules step.
- To add an extra module in code, add it to the XafApplication.Modules or ModuleBase.RequiredModuleTypes list (adding a reference to the module assembly is insufficient).
In .NET 6+ applications, you can call the AddCharts(IModuleBuilder<IWinApplicationBuilder>) method in your WinForms application builder.
A step-by step guide to using the Chart module is provided in the How to: Display a List View as a Chart topic. The charting List Editors described here are demonstrated in the List Editors section of the Feature Center demo. The default location of the application is %PUBLIC%\Documents\DevExpress Demos 23.2\Components\XAF\FeatureCenter.NETFramework.XPO.
Chart List Editors
The Chart module supplies two List Editors - ChartListEditor for WinForms and ASPxChartListEditor for ASP.NET Web Forms. These List Editors are based on the WinForms Chart Control and ASP.NET Web Forms Chart Control, and display a List View as a chart.
To display a certain List View as a chart, find this List View’s node in the Model Editor invoked for the WinForms or ASP.NET Web Forms module project, and change the IModelListView.EditorType property value to DevExpress.ExpressApp.Chart.Win.ChartListEditor or DevExpress.ExpressApp.Chart.Web.ASPxChartListEditor.
Configure Charts in the Application Model
Both WinForms and ASP.NET Web Forms chart controls can be configured in the Application Model. Invoke the Model Editor, navigate to the required List View’s ChartSettings node, and click the ellipsis button ( ) for the Settings property. This will invoke the Chart Designer. If you invoke the Model Editor in a platform-agnostic module, the settings specified in the Chart Designer will be applied to both WinForms and ASP.NET Web Forms chart controls.
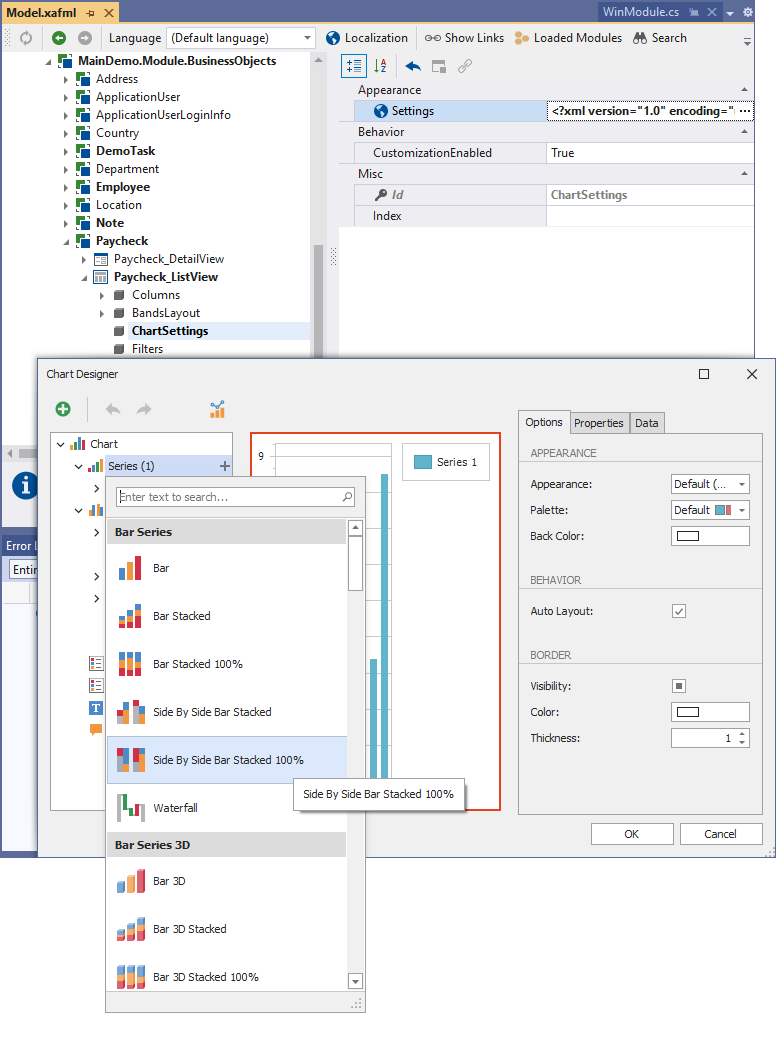
In WinForms applications, end-users can also invoke the designer at runtime, and reset settings to their defaults using the chart’s context menu, when the Application Model‘s ICustomizationEnabledProvider.CustomizationEnabled property of the List View’s ChartSettings node is set to true.

Runtime settings are saved to user differences (the Model.User.xafml file, by default).
Configure Charts in Code
Both WinForms and ASP.NET Web Forms chart controls have a number of settings that are unavailable in the Chart Wizard, but can be changed directly in code, by accessing chart control properties. Additionally, you may wish to change chart behavior by handling a control’s events. To access a chart control instance in code, implement a View Controller, get the current List Editor, and handle the ListEditor.ControlsCreated event. The following code should be placed in a platform-specific module project.
WinForms
using System;
using DevExpress.ExpressApp;
using DevExpress.ExpressApp.Chart.Win;
using DevExpress.XtraCharts;
// ...
public class MyWinController : ViewController<ListView> {
    protected override void OnActivated() {
        base.OnActivated();
        View.Editor.ControlsCreated += Editor_ControlsCreated;
    }
    void Editor_ControlsCreated(object sender, EventArgs e) {
        var chartListEditor = View.Editor as ChartListEditor;
        if(chartListEditor != null) {
            ChartControl chart = chartListEditor.Control as ChartControl;
            if(chart != null) {
                // Place your chart configuration code here.
            }
        }
    }
}
ASP.NET Web Forms
using System;
using DevExpress.ExpressApp;
using DevExpress.ExpressApp.Chart.Web;
using DevExpress.XtraCharts.Web;
// ...
public class MyWebController : ViewController<ListView> {
    protected override void OnActivated() {
        base.OnActivated();
        View.Editor.ControlsCreated += Editor_ControlsCreated;
    }
    void Editor_ControlsCreated(object sender, EventArgs e) {
        var chartListEditor = View.Editor as ASPxChartListEditor;
        if(chartListEditor != null) {
            WebChartControl chart = chartListEditor.ChartControl;
            if(chart != null) {
                // Place your chart configuration code here.
            }
        }
    }
}
To learn more about chart controls, including their properties and events, refer to the ChartControl and WebChartControl documents. Note that these classes reside within the DevExpress.XtraCharts.v23.2.UI.dll and DevExpress.XtraCharts.v23.2.Web.dll assemblies, so you should add a corresponding reference to compile the code above.
Export And Print Charts
Since Chart List Editors implement the IExportable interface, charts can be exported using the ExportController.ExportAction Action and printed using the PrintingController.PrintAction Action. You can customize the behavior of these Actions by handling the events of the ExportController and PrintingController classes (see How to: Customize Export Options of the Printing System and How to: Customize the Export Action Behavior).
Print and Export Actions in a WinForms Application:

Print Preview in a WinForms Application:

Export Action in an ASP.NET Web Forms Application:
