How to: Display Several Views Side-by-Side
- 3 minutes to read
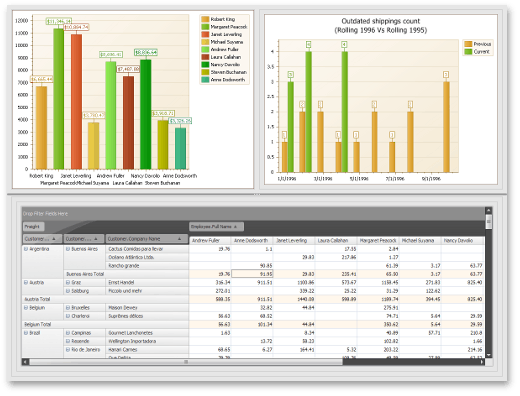
This topic demonstrates how you can display several Views side-by-side on a single screen. For this purpose, the “Simple Dashboard” Dashboard View, demonstrated in the FeatureCenter Demo, installed with XAF, will be recreated from scratch. Dashboard Views are a special View type, designed specifically to display any number of unrelated Views in single Frame.
If you need to display a List View together with the Detail View displaying the List View’s currently selected object properties, in a Windows Forms XAF application, refer to the List View Edit Modes help topic instead.
To begin this tutorial, open the FeatureCenter demo solution located in the %PUBLIC%\Documents\DevExpress Demos 20.2\Components.NET Core Desktop Libraries\eXpressApp Framework\FeatureCenter\CS folder, by default, and specify a valid database connection string for your application project. To learn how to specify connection strings, refer to the Connect an XAF Application to a Database Provider help topic.
Create a Dashboard View
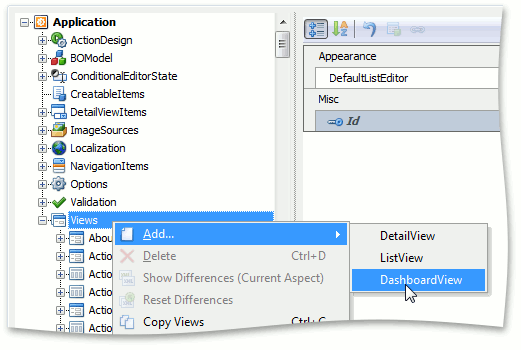
First, create a Dashboard View that will be used to display several Views side-by-side. For this purpose, invoke the Model Editor for the FeatureCenter.Module.Win project. Right-click the Views node and add a Dashboard View.
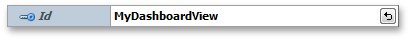
Set the Id property of the created View to MyDashboardView.
Specify the Views to Be Displayed on the Dashboard View
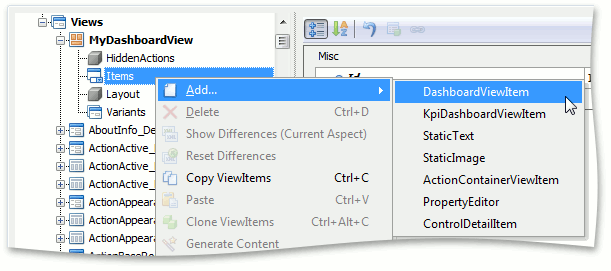
Second, specify the Views to be displayed on the Dashboard View, by creating Dashboard View Items. A DashboardViewItem displays a View specified by the item’s IModelDashboardViewItem.View property of the Application Model‘s corresponding DashboardViewItem node. Right-click the Items node and add a Dashboard View Item.
Set the View property of the created Dashboard View Item to Order_ListView_PivotGrid_SalesAnalysis.
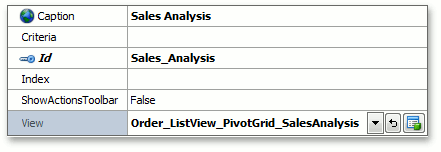
Note
In the Feature Center application, the Order_ListView_PivotGrid_SalesAnalysis List View is visualized by the Pivot Grid List Editor (the List View’s IModelListView.EditorType property is set to PivotGridListEditor for WinForms application and to ASPxPivotGridListEditor for ASP.NET in the Model Editor). Refer to the Pivot Grid Module topic to learn more.
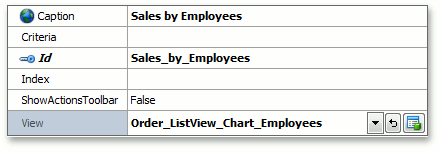
Add another Dashboard View Item and set its View property to Order_ListView_Chart_Employees.
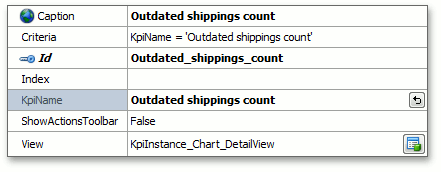
Add a KPI Dashboard View Item. Such items are used to display Key Performance Indicator results provided by the KPI Module. Set the KpiName property of the created item to Outdated shippings count.
Note that Dashboard Views support a wide range of View Items. So, a Dashboard View can display not only Views but images, blocks of text and Action Containers. For this purpose, you can add StaticText, StaticImage and ActionContainerViewItem View Items to the Dashboard View.
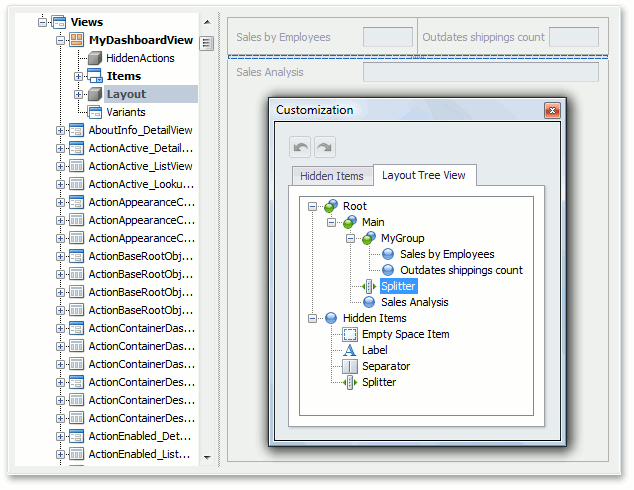
Configure the Dashboard View Layout
Third, configure the Dashboard View layout as you like. For a thorough explanation of how to customize a View layout, refer to the View Items Layout Customization help topic.
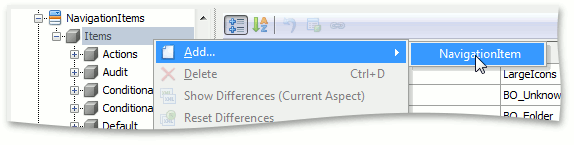
Create a Navigation Item
Finally, create a navigation item, so that users can invoke the created Dashboard View. Right-click the Items child node of the NavigationItems node and add a Navigation Item.
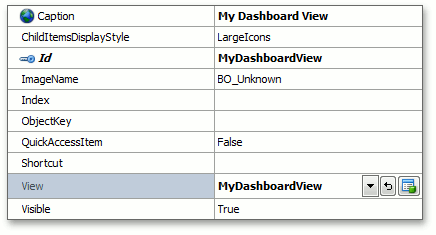
Set the View property of the created View to MyDashboardView.
Run the application, and you will be able to see the created Dashboard View in action.