# Integrate the WPF Pivot Grid with the Chart Control | WPF Controls | DevExpress Documentation
Tip
You can use [DevExpress BI Dashboard](/Dashboard/116677/basic-concepts-and-terminology/what-is-bi-dashboard) to build data visualization and analysis UIs that include Charts, Grids, Maps, Pivot Grids, Cards, Range Selectors, and other elements. This cross-platform product is available as part of the [DevExpress Universal Subscription](https://www.devexpress.com/products/try/).
Review the following help topic to learn the basics: [Get Started with the DevExpress Dashboard](/Dashboard/12136/get-started).
The [ChartControl](/WPF/DevExpress.Xpf.Charts.ChartControl) can load and visualize data directly from the [PivotGridControl](/WPF/DevExpress.Xpf.PivotGrid.PivotGridControl) control. The Pivot Grid contains a specific option set that configures how it provides its data. This guide explains how to configure the Pivot Charting bundle containing the Pivot Grid control and the Chart Control.
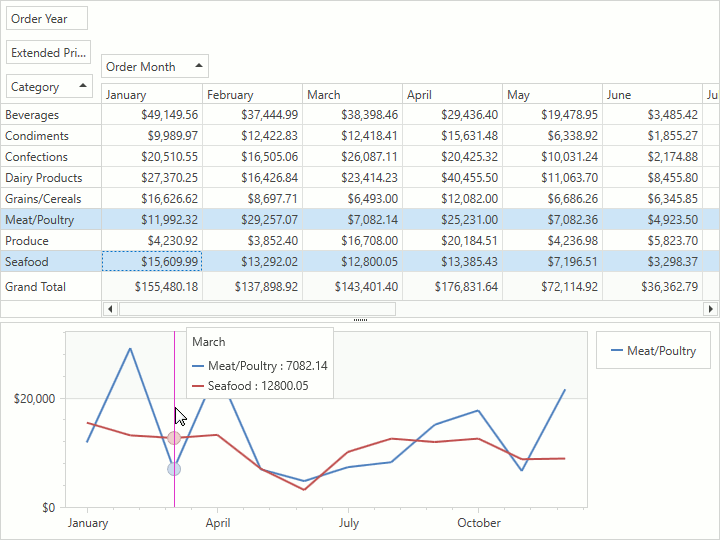
[Run Demo: Charts Integration](dxdemo://Wpf/DXPivotGrid/MainDemo/ChartsIntegration)
## Pivot Grid Data Providing Basics
The following code snippet demonstrates how to [automatically create a Chart’s series](/WPF/7922/controls-and-libraries/charts-suite/chart-control/provide-data/define-a-template-for-automatic-series) visualizing the Pivot Grid’s data that the [PivotGridControl.ChartDataSource](/WPF/DevExpress.Xpf.PivotGrid.PivotGridControl.ChartDataSource) property provides:
- XAML
<dxpg:PivotGridControl x:Name="pivotGridControl"
                       ChartProvideDataByColumns="True"
                       ChartSelectionOnly="True">
    <!-- Pivot Grid Configuration-->
</dxpg:PivotGridControl>
<dxc:ChartControl DataSource="{Binding ElementName=pivotGridControl, Path=ChartDataSource}">
    <!-- ChartDataSource  provides three data members whose names -->
    <!-- should be assigned to the Chart's data member properties for correct data visualization: -->
    <!-- "Series" to the SeriesDataMember property, "Arguments" to ArgumentDataMember -->
    <!-- and "Values" to ValueDataMember. -->
    <dxc:XYDiagram2D SeriesDataMember="Series">
        <dxc:XYDiagram2D.SeriesTemplate>
            <dxc:LineSeries2D ArgumentDataMember="Arguments"
                              ValueDataMember="Values"/>
        </dxc:XYDiagram2D.SeriesTemplate>
    </dxc:XYDiagram2D>
</dxc:ChartControl>
The following Pivot Grid options configure how the Pivot Grid initializes its chart data source:
| Property | Description |
| --- | --- |
| **Incoming Data Format** | |
| [PivotGridControl.ChartProvideDataByColumns](/WPF/DevExpress.Xpf.PivotGrid.PivotGridControl.ChartProvideDataByColumns) | Specifies whether the Pivot Grid initializes its Chart Data Source items’ **Series** field using column values. |
| [PivotGridControl.ChartProvideEmptyCells](/WPF/DevExpress.Xpf.PivotGrid.PivotGridControl.ChartProvideEmptyCells) | Specifies whether the Pivot Grid provides Chart Data Source items generated by cells that have empty values. |
| [PivotGridControl.ChartFieldValuesProvideMode](/WPF/DevExpress.Xpf.PivotGrid.PivotGridControl.ChartFieldValuesProvideMode) | Specifies the value indicating which field values the Pivot Grid passes to a Chart. |
| [PivotGridControl.ChartProvideCellValuesAsType](/WPF/DevExpress.Xpf.PivotGrid.PivotGridControl.ChartProvideCellValuesAsType) | Gets or sets the type to which Pivot Chart converts cell values to export them to a Chart. |
| [PivotGridControl.ChartProvideColumnFieldValuesAsType](/WPF/DevExpress.Xpf.PivotGrid.PivotGridControl.ChartProvideColumnFieldValuesAsType) | Gets or sets the type to which Pivot Chart converts column field values to export them to a Chart. |
| [PivotGridControl.ChartProvideRowFieldValuesAsType](/WPF/DevExpress.Xpf.PivotGrid.PivotGridControl.ChartProvideRowFieldValuesAsType) | Gets or sets the type to which Pivot Chart converts row field values to export them to a Chart. |
| **Pivot Grid Totals Treatment** | |
| [PivotGridControl.ChartProvideColumnCustomTotals](/WPF/DevExpress.Xpf.PivotGrid.PivotGridControl.ChartProvideColumnCustomTotals) | Gets or sets whether column [custom totals](/WPF/8006/controls-and-libraries/pivot-grid/ui-elements/totals) should be passed to a chart control. This is a dependency property. |
| [PivotGridControl.ChartProvideColumnGrandTotals](/WPF/DevExpress.Xpf.PivotGrid.PivotGridControl.ChartProvideColumnGrandTotals) | Gets or sets whether [column grand totals](/WPF/8001/controls-and-libraries/pivot-grid/ui-elements/grand-totals) are passed to a chart control. This is a dependency property. |
| [PivotGridControl.ChartProvideColumnGrandTotals](/WPF/DevExpress.Xpf.PivotGrid.PivotGridControl.ChartProvideColumnGrandTotals) | Gets or sets whether [column grand totals](/WPF/8001/controls-and-libraries/pivot-grid/ui-elements/grand-totals) are passed to a chart control. This is a dependency property. |
| [PivotGridControl.ChartProvideRowCustomTotals](/WPF/DevExpress.Xpf.PivotGrid.PivotGridControl.ChartProvideRowCustomTotals) | Gets or sets whether row [custom totals](/WPF/8006/controls-and-libraries/pivot-grid/ui-elements/totals) should be displayed in a chart control. This is a dependency property. |
| [PivotGridControl.ChartProvideRowGrandTotals](/WPF/DevExpress.Xpf.PivotGrid.PivotGridControl.ChartProvideRowGrandTotals) | Gets or sets whether [row grand totals](/WPF/8001/controls-and-libraries/pivot-grid/ui-elements/grand-totals) are passed to a chart control.
This is a dependency property. |
| [PivotGridControl.ChartProvideRowTotals](/WPF/DevExpress.Xpf.PivotGrid.PivotGridControl.ChartProvideRowTotals) | Gets or sets whether row [totals](/WPF/8006/controls-and-libraries/pivot-grid/ui-elements/totals) are passed to a chart control.
This is a dependency property. |
| **Limiting the Series and Point Number** | |
| [PivotGridControl.ChartMaxPointCountInSeries](/WPF/DevExpress.Xpf.PivotGrid.PivotGridControl.ChartMaxPointCountInSeries) | Gets or sets the maximum allowed number of points in a series.
This is a dependency property. |
| [PivotGridControl.ChartMaxSeriesCount](/WPF/DevExpress.Xpf.PivotGrid.PivotGridControl.ChartMaxSeriesCount) | Gets or sets the maximum allowed number of series in the chart data source.
This is a dependency property. |
| **Additional options** | |
| [PivotGridControl.ChartSelectionOnly](/WPF/DevExpress.Xpf.PivotGrid.PivotGridControl.ChartSelectionOnly) | Gets or sets whether a chart control should visualize data from the selected cells only. |
| [PivotGridControl.ChartUpdateDelay](/WPF/DevExpress.Xpf.PivotGrid.PivotGridControl.ChartUpdateDelay) | Gets or sets the delay between changing the cell focus or selection, and updating the bound Chart control.
This is a dependency property. |
Note
The [PivotGridControl.ChartMaxSeriesCount](/WPF/DevExpress.Xpf.PivotGrid.PivotGridControl.ChartMaxSeriesCount) and [PivotGridControl.ChartMaxPointCountInSeries](/WPF/DevExpress.Xpf.PivotGrid.PivotGridControl.ChartMaxPointCountInSeries) properties’ default values limit series’ and series points’ count. Set these properties to **0** to remove the limit.
## Data Providing Specifics
The Pivot Grid provides its data to the Chart in the following manner if [PivotGridControl.ChartProvideDataByColumns](/WPF/DevExpress.Xpf.PivotGrid.PivotGridControl.ChartProvideDataByColumns) property is set to **true**:
- The values of data members specifying **columns** to the ChartDataSource item’s Series values.
- The values of data members specifying **rows** to the ChartDataSource item’s Argument values.
- The summarized values to the ChartDataSource item’s Series values.
Otherwise:
- The values of data members specifying **rows** to the ChartDataSource item’s Series values.
- The values of data members specifying **columns** to the ChartDataSource item’s Argument values.
- The summarized values to the ChartDataSource item’s Series values.
If multiple fields identify a column/row, the respective field values connected by the ‘|’ sign construct the corresponding data member value (for example, ‘1995 | January’).
When a Pivot Grid contains multiple [data fields](/WPF/7988/controls-and-libraries/pivot-grid/ui-elements/data-field) with different data types ([PivotGridField.DataType](/WPF/DevExpress.Xpf.PivotGrid.PivotGridField.DataType)), it converts [cell](/WPF/7984/controls-and-libraries/pivot-grid/ui-elements/cell) values to [Decimal](https://learn.microsoft.com/dotnet/api/system.decimal) if possible; otherwise it sets its cell values to 0. Use the [PivotGridControl.ChartProvideCellValuesAsType](/WPF/DevExpress.Xpf.PivotGrid.PivotGridControl.ChartProvideCellValuesAsType) property to override this behavior specifying a data type to which [cell](/WPF/7984/controls-and-libraries/pivot-grid/ui-elements/cell) values should be converted.
The ChartControl supports only Numeric and DateTime series point values (see [Series Scale Types](/WPF/8453/controls-and-libraries/charts-suite/chart-control/provide-data/series-scale-types) to learn more). To convert cell values into an appropriate type manually, handle the [PivotGridControl.CustomChartDataSourceData](/WPF/DevExpress.Xpf.PivotGrid.PivotGridControl.CustomChartDataSourceData) event.
When choosing a Chart type, note that only Series with a **single value per Series point** are supported.
## Example
- [How to: Visualize Data from a Pivot Grid Control using the Chart Control](/WPF/8030/controls-and-libraries/pivot-grid/examples/miscellaneous/how-to-visualize-data-from-a-pivot-grid-control-using-the-chart-control)