# Axis Labels | WPF Controls | DevExpress Documentation
The Chart Control can display default and custom [axis](/WPF/6334/controls-and-libraries/charts-suite/chart-control/axes/axes) labels. Default labels are generated based on series data.

The Chart Control automatically calculates the grid layout so that certain axis labels are hidden depending on the actual chart size to avoid overlapping labels.
The following image illustrates the chart layout with hidden X-Axis labels (region):

To display all axis labels, disable the scale’s `AutoGrid` option and set the `GridSpacing` property to `1`.

## Configure Custom Labels
You can create custom axis labels and modify their position and content. The Chart Control can display custom and default labels simultaneously. The following image shows custom axis labels for a Y-axis:

Use the markup below to configure custom axis labels:
- XAML
<dxc:XYDiagram2D.AxisY>
      <dxc:AxisY2D LabelVisibilityMode="Default"
                   GridLinesMinorVisible="False"
                   Interlaced="False"
                   Brush="Transparent">
            <dxc:AxisY2D.CustomLabels>
                  <dxc:CustomAxisLabel Value="120" Content="2h"/>
                  <dxc:CustomAxisLabel Value="360" Content="6h"/>
                  <dxc:CustomAxisLabel Value="600" Content="10h"/>
                  <dxc:CustomAxisLabel Value="840" Content="14h"/>
            </dxc:AxisY2D.CustomLabels>
      </dxc:AxisY2D>
</dxc:XYDiagram2D.AxisY>
This code uses the following API members:
| Class or Property | Description |
| --- | --- |
| [Axis2D.CustomLabels](/WPF/DevExpress.Xpf.Charts.Axis2D.CustomLabels) | The custom axis labels’ collection. If this collection is empty, the Chart Control displays default axis labels. |
| [CustomAxisLabel](/WPF/DevExpress.Xpf.Charts.CustomAxisLabel) | A custom axis label. |
| [CustomAxisLabel.Value](/WPF/DevExpress.Xpf.Charts.CustomAxisLabel.Value) | A value that specifies a label position along an axis. |
| [CustomAxisLabel.Content](/WPF/DevExpress.Xpf.Charts.CustomAxisLabel.Content) | Custom label content. |
| [Axis2D.LabelVisibilityMode](/WPF/DevExpress.Xpf.Charts.Axis2D.LabelVisibilityMode) | Specifies whether to show custom and default axis labels simultaneously. |
If the [Axis2D.CustomLabels](/WPF/DevExpress.Xpf.Charts.Axis2D.CustomLabels) collection does not contain any visible custom labels, the default axis labels are shown. Set the [Axis2D.LabelVisibilityMode](/WPF/DevExpress.Xpf.Charts.Axis2D.LabelVisibilityMode) property to [AutoGeneratedAndCustom](/WPF/DevExpress.Xpf.Charts.AxisLabelVisibilityMode)
to display custom and default labels simultaneously.
### How to Use the MVVM Design Pattern
To generate custom axis labels from a ViewModel, bind the [Axis2D.CustomLabelItemsSource](/WPF/DevExpress.Xpf.Charts.Axis2D.CustomLabelItemsSource) property to a collection of objects that contain label parameters. Use the [Axis2D.CustomLabelItemTemplate](/WPF/DevExpress.Xpf.Charts.Axis2D.CustomLabelItemTemplate) or [Axis2D.CustomLabelItemTemplateSelector](/WPF/DevExpress.Xpf.Charts.Axis2D.CustomLabelItemTemplateSelector)
property to specify how to convert a model object to a custom label.
The following example shows how to generate custom labels for a y-axis:
- XAML
<Window.DataContext>
    <local:MainViewModel/>
</Window.DataContext>

<dxc:XYDiagram2D.AxisY>
    <dxc:AxisY2D x:Name="axisY"
                 GridLinesMinorVisible="False"
                 Interlaced="False"
                 Brush="Transparent"
                 CustomLabelItemsSource="{Binding CustomLabels}">
        <dxc:AxisY2D.CustomLabelItemTemplate>
            <DataTemplate>
                <dxc:CustomAxisLabel Value="{Binding Item1}"
                                     Content="{Binding Item2}"/>
            </DataTemplate>
        </dxc:AxisY2D.CustomLabelItemTemplate>
    </dxc:AxisY2D>
</dxc:XYDiagram2D.AxisY>
- C#
- VB.NET
public class MainViewModel {
    public IEnumerable<Tuple<double, string>> CustomLabels { get; private set; }
    public MainViewModel() {
        this.CustomLabels = new List<Tuple<double, string>> {
            new Tuple<double, string>(120, "2h"),
            new Tuple<double, string>(360, "6h"),
            new Tuple<double, string>(600, "10h"),
            new Tuple<double, string>(840, "14h")
        };
    }
}
Public Class MainViewModel
    Public Property CustomLabels As IEnumerable(Of Tuple)
        Get
        End Get
        Set
        End Set
    End Property
    Public Sub New()
        MyBase.New
        Me.CustomLabels = New List(Of Tuple)() {
                         New Tuple(Of Double, String)(120, "2h"),
                         New Tuple(Of Double, String)(360, "6h"),
                         New Tuple(Of Double, String)(600, "10h"),
                         New Tuple(Of Double, String)(840, "14h")}
    End Sub
End Class
The code above uses the following API members:
| Member | Description |
| --- | --- |
| [Axis2D.CustomLabelItemsSource](/WPF/DevExpress.Xpf.Charts.Axis2D.CustomLabelItemsSource) | Gets or sets the collection that is used to generate custom labels. |
| [Axis2D.CustomLabelItemTemplate](/WPF/DevExpress.Xpf.Charts.Axis2D.CustomLabelItemTemplate) | Specifies the [DataTemplate](https://learn.microsoft.com/dotnet/api/system.windows.datatemplate) object that defines how to convert a model object to a custom label. |
| [Axis2D.CustomLabelItemTemplateSelector](/WPF/DevExpress.Xpf.Charts.Axis2D.CustomLabelItemTemplateSelector) | Gets or sets the [DataTemplateSelector](https://learn.microsoft.com/dotnet/api/system.windows.controls.datatemplateselector) object that defines the custom logic to select a data template that converts a model to a custom label. |
## How to Format Default Label Text
Use the predefined placeholders, [format specifiers](/WPF/10408/common-concepts/formatting-values/format-specifiers), and plain text to set a pattern that defines a label’s text. In the image below, the **{V} min** pattern is applied to the y-axis labels.

The following markup configures the label’s text pattern:
- XAML
<dxc:XYDiagram2D.AxisY>
      <dxc:AxisY2D GridLinesMinorVisible="False"
                   Interlaced="False"
                   Brush="Transparent">
            <dxc:AxisY2D.Label>
                  <dxc:AxisLabel TextPattern="{}{V} min"/>
            </dxc:AxisY2D.Label>
      </dxc:AxisY2D>
</dxc:XYDiagram2D.AxisY>
The code above uses the classes and properties from the table below:
| Class or Property | Description |
| --- | --- |
| [AxisLabel.TextPattern](/WPF/DevExpress.Xpf.Charts.AxisLabel.TextPattern) | Specifies the text pattern. |
| [AxisBase.Label](/WPF/DevExpress.Xpf.Charts.AxisBase.Label) | Specifies label settings. |
| [AxisLabel](/WPF/DevExpress.Xpf.Charts.AxisLabel) | The axis label settings’ storage. |
The following table lists all available placeholders:
| Pattern | Description |
| --- | --- |
| {A} | Displays series point arguments (only for argument axes). |
| {V} | Displays series point values (only for value axes). |
| {VP} | Displays series point values as a percentage (only for value axes). |
You can also specify the [AxisLabel.Formatter](/WPF/DevExpress.Xpf.Charts.AxisLabel.Formatter) property to generate text strings for axis labels based on a custom condition or change the [order of magnitude](https://en.wikipedia.org/wiki/Order_of_magnitude) of axis label values. If the **Formatter** property is specified, the [AxisLabel.TextPattern](/WPF/DevExpress.Xpf.Charts.AxisLabel.TextPattern) value is ignored.
`TextPattern` can be applied to date-time or numeric scale values. Use `Formatter` for the [qualitative](/WPF/DevExpress.Xpf.Charts.ScaleType) scale type.
Follow the steps below to create a formatter:
- Create a class that inherits the [IAxisLabelFormatter](/WPF/DevExpress.Xpf.Charts.IAxisLabelFormatter) interface and implement the **GetAxisLabelText** method.
- Assign the newly created class instance to the [AxisLabel.Formatter](/WPF/DevExpress.Xpf.Charts.AxisLabel.Formatter) property.
This example shows how to apply a custom format to numeric axis labels:
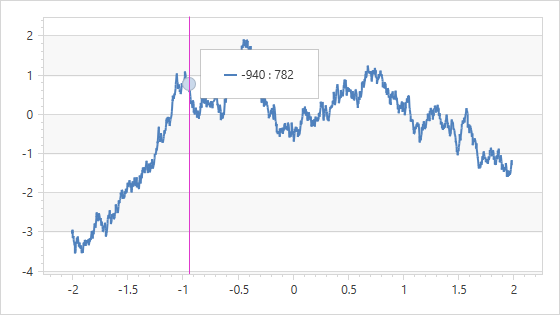A formatter applies to axis labels:
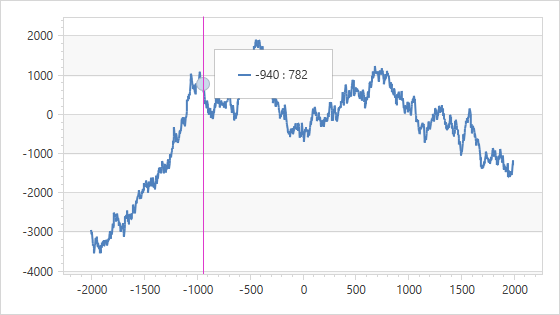A formatter does not apply to axis labels:
**Markup:**
- XAML
<dxc:XYDiagram2D.AxisX>
    <dxc:AxisX2D>
        <dxc:AxisX2D.Label>
            <dxc:AxisLabel>
                <dxc:AxisLabel.Formatter>
                    <local:AxisLabelFormatter/>
                </dxc:AxisLabel.Formatter>
            </dxc:AxisLabel>
        </dxc:AxisX2D.Label>
    </dxc:AxisX2D>
</dxc:XYDiagram2D.AxisX>
<dxc:XYDiagram2D.AxisY>
    <dxc:AxisY2D>
            <dxc:AxisLabel>
                <dxc:AxisLabel.Formatter>
                    <local:AxisLabelFormatter/>
                </dxc:AxisLabel.Formatter>
            </dxc:AxisLabel>
        </dxc:AxisY2D.Label>
    </dxc:AxisY2D>
</dxc:XYDiagram2D.AxisY>
**Code-Behind:**
- C#
- VB.NET
public class AxisLabelFormatter : IAxisLabelFormatter {
    public string GetAxisLabelText(object axisValue) {
        return Convert.ToString((double)axisValue / 1000);
    }
}
Public Class AxisLabelFormatter
    Inherits IAxisLabelFormatter
    Public Function GetAxisLabelText(ByVal axisValue As Object) As String
        Return Convert.ToString(CDbl(axisValue) / 1000)
    End Function
End Class
## Resolve Axis Label Overlap
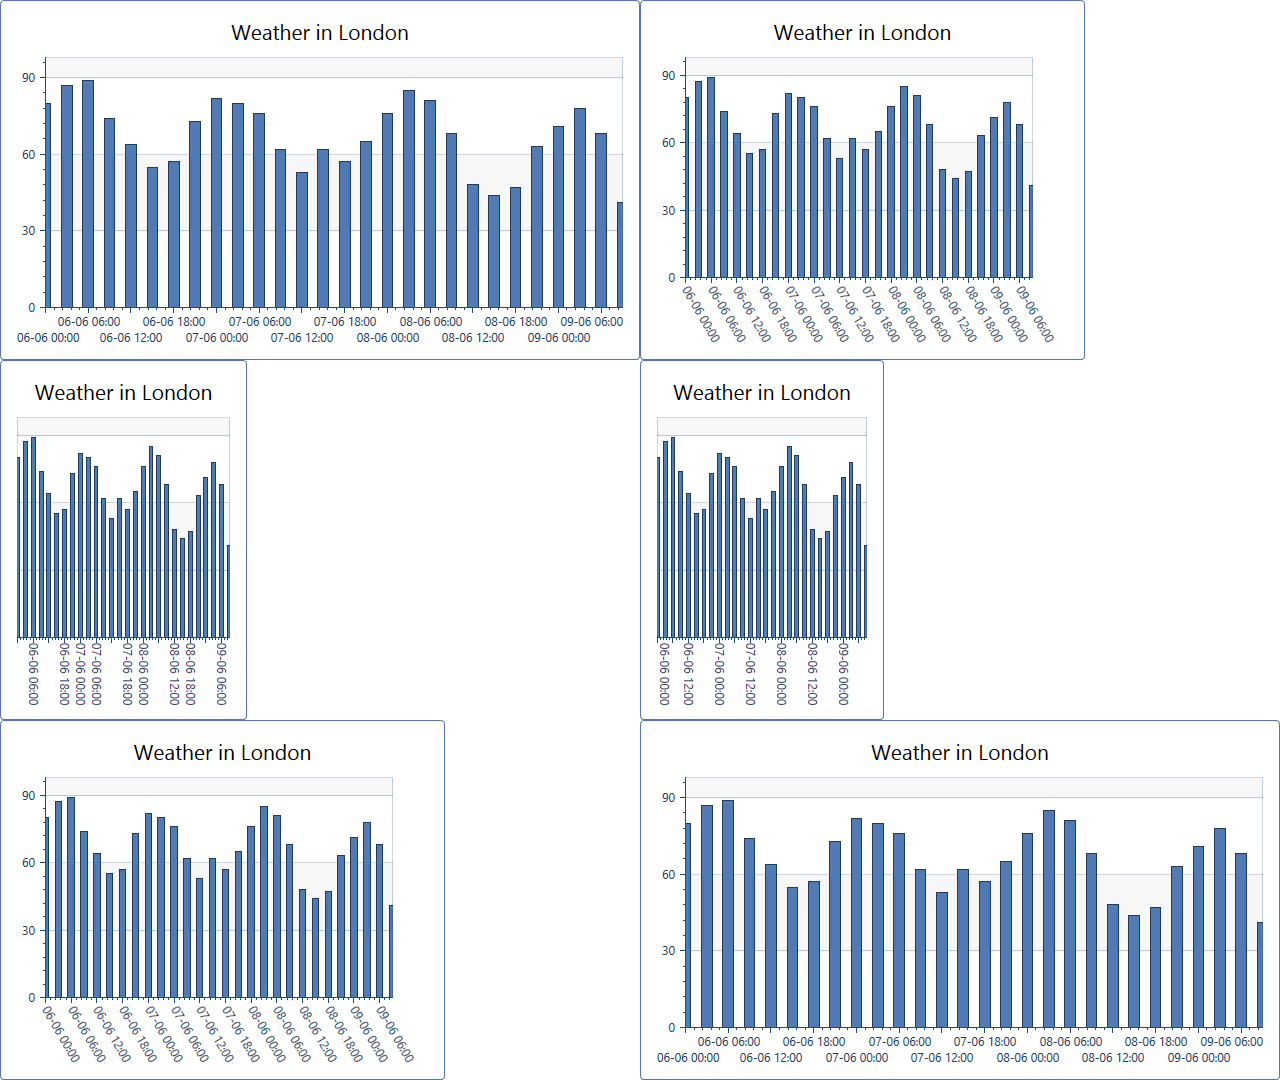
The Chart Control includes a Resolve Overlap algorithm that rotates, staggers and hides axis labels when they cannot sufficiently display label content due to lack of space. You can use the Resolve Overlap options to configure this algorithm. The image below shows a chart with these options disabled.

The following animation shows how the Resolve Overlap algorithm works:
The example below configures the Resolve Overlap algorithm options:
[View Example: Configure Resolve Overlapping for Axis Labels](https://github.com/DevExpress-Examples/wpf-chart-configure-resolve-overlapping-for-axis-labels)
- XAML
<dxc:XYDiagram2D.AxisX>
    <dxc:AxisX2D>
        <dxc:AxisX2D.DateTimeScaleOptions>
            <dxc:ManualDateTimeScaleOptions MeasureUnit="Hour"
                        GridAlignment="Hour"
                        GridSpacing="6"
                        AutoGrid="False" />
        </dxc:AxisX2D.DateTimeScaleOptions>
        <dxc:AxisX2D.Label>
            <dxc:AxisLabel TextPattern="{}{A:dd/MM HH:mm}">
                <dxc:Axis2D.ResolveOverlappingOptions>
                    <dxc:AxisLabelResolveOverlappingOptions AllowHide="True"
                                AllowRotate="True"
                                AllowStagger="True"
                                MinIndent="5" />
                </dxc:Axis2D.ResolveOverlappingOptions>
            </dxc:AxisLabel>
        </dxc:AxisX2D.Label>
    </dxc:AxisX2D>
</dxc:XYDiagram2D.AxisX>
The code above uses the following API members:
| Member | Description |
| --- | --- |
| [Axis2D.ResolveOverlappingOptions](/WPF/DevExpress.Xpf.Charts.Axis2D.ResolveOverlappingOptions) | Settings that define how to resolve label overlap. |
| [AxisLabelResolveOverlappingOptions.AllowHide](/WPF/DevExpress.Xpf.Charts.AxisLabelResolveOverlappingOptions.AllowHide) | Gets or sets the value that indicates whether to hide axis labels to resolve overlap. |
| [AxisLabelResolveOverlappingOptions.AllowRotate](/WPF/DevExpress.Xpf.Charts.AxisLabelResolveOverlappingOptions.AllowRotate) | Specifies the value that indicates whether to rotate axis labels. |
| [AxisLabelResolveOverlappingOptions.AllowStagger](/WPF/DevExpress.Xpf.Charts.AxisLabelResolveOverlappingOptions.AllowStagger) | Gets or sets the value that indicates whether to stagger axis labels. |
| [AxisLabelResolveOverlappingOptions.MinIndent](/WPF/DevExpress.Xpf.Charts.AxisLabelResolveOverlappingOptions.MinIndent) | Gets or sets the minimum indent between adjacent axis labels when the Resolve Overlap algorithm is applied. |
Note
The **AllowRotate** and **AllowStagger** properties only affect labels of a horizontal [2D XY Diagram](/WPF/115312/controls-and-libraries/charts-suite/chart-control/diagram/2d-xy-diagram) axis (the argument x-axis, or the value y-axis when [XYDiagram2D.Rotated](/WPF/DevExpress.Xpf.Charts.XYDiagram2D.Rotated) is set to **true**).
The following example uses the [Axis2D.SetResolveOverlappingOptions](/WPF/DevExpress.Xpf.Charts.Axis2D.SetResolveOverlappingOptions%28DevExpress.Xpf.Charts.AxisLabel-DevExpress.Xpf.Charts.AxisLabelResolveOverlappingOptions%29) method to specify the Resolve Overlap options for an X-axis in code:
- C#
- VB.NET
AxisLabel xLabel = new AxisLabel();
Axis2D.SetResolveOverlappingOptions(xLabel, new AxisLabelResolveOverlappingOptions() { AllowHide = false,
                                                                                       AllowRotate = false,
                                                                                       AllowStagger = false});
((XYDiagram2D)chartControl1.Diagram).ActualAxisX.Label = xLabel;
Dim xLabel As AxisLabel = New AxisLabel()
Axis2D.SetResolveOverlappingOptions(xLabel, New AxisLabelResolveOverlappingOptions() With {
        .AllowHide = False,
        .AllowRotate = False,
        .AllowStagger = False
})
CType(chartControl1.Diagram, XYDiagram2D).ActualAxisX.Label = xLabel
## Customize Label Appearance
You can change the text color, background color, font, and orientation of axis labels.

**In Markup**
- XAML
<dxc:XYDiagram2D.AxisX>
    <dxc:AxisX2D Visible="True">
        <dxc:AxisX2D.Label>
            <dxc:AxisLabel Foreground="DarkSlateBlue"
                           Background="LightBlue"
                           FontSize="14"
                           FontStyle="Italic"
                           FontWeight="Bold"
                           Angle="45"
                           TextPattern="{}{V} year"/>
        </dxc:AxisX2D.Label>
    </dxc:AxisX2D>
</dxc:XYDiagram2D.AxisX>
**In Code-Behind**
- C#
- VB.NET
XYDiagram2D diagram = (XYDiagram2D)chartControl1.Diagram;
diagram.AxisX = new AxisX2D();
diagram.AxisX.Label = new AxisLabel();
diagram.AxisX.Label.Background = new SolidColorBrush(Colors.Orange);
diagram.AxisX.Label.Foreground = new SolidColorBrush(Colors.DarkSlateBlue);
diagram.AxisX.Label.FontSize= 14;
diagram.AxisX.Label.FontStyle = FontStyles.Italic;
diagram.AxisX.Label.FontWeight = FontWeights.Bold;
Dim diagram As XYDiagram2D = CType(chartControl1.Diagram, XYDiagram2D)
diagram.AxisX = New AxisX2D
diagram.AxisX.Label = New AxisLabel
diagram.AxisX.Label.Background = New SolidColorBrush(Colors.Orange)
diagram.AxisX.Label.Foreground = New SolidColorBrush(Colors.DarkSlateBlue)
diagram.AxisX.Label.FontSize = 14
diagram.AxisX.Label.FontStyle = FontStyles.Italic
diagram.AxisX.Label.FontWeight = FontWeights.Bold
The following appearance customization properties are available:
- [Angle](/WPF/DevExpress.Xpf.Charts.AxisLabel.Angle) (also specifies rotation for a data template defined in the [AxisLabel.ElementTemplate](/WPF/DevExpress.Xpf.Charts.AxisLabel.Angle) property.)
- [Background](https://learn.microsoft.com/dotnet/api/system.windows.controls.control.background)
- [BorderBrush](https://learn.microsoft.com/dotnet/api/system.windows.controls.control.borderbrush)
- [BorderThickness](https://learn.microsoft.com/dotnet/api/system.windows.controls.control.borderthickness)
- [FontFamily](https://learn.microsoft.com/dotnet/api/system.windows.controls.control.fontfamily)
- [FontSize](https://learn.microsoft.com/dotnet/api/system.windows.controls.control.fontsize)
- [FontStretch](https://learn.microsoft.com/dotnet/api/system.windows.controls.control.fontstretch)
- [FontStyle](https://learn.microsoft.com/dotnet/api/system.windows.controls.control.fontstyle)
- [FontWeight](https://learn.microsoft.com/dotnet/api/system.windows.controls.control.fontweight)
- [Foreground](https://learn.microsoft.com/dotnet/api/system.windows.controls.control.foreground)
- [Padding](https://learn.microsoft.com/dotnet/api/system.windows.controls.control.padding)
You can also define the [ElementTemplate](/WPF/DevExpress.Xpf.Charts.ChartTextElement.ElementTemplate) property to change axis label appearance:

- XAML
<Window.Resources>
    <DataTemplate x:Key="AxisXLabelTemplate">
        <Border BorderThickness="1" CornerRadius="9" Opacity="1.0">
            <Border.Background>
                <SolidColorBrush Color="Orange"/>
            </Border.Background>
            <Label Content="{Binding Path=Content}" Padding="5,1,5,1.5"
                   Foreground="DarkSlateBlue" FontSize="12" />
        </Border>
    </DataTemplate>
</Window.Resources>
...
<dxc:XYDiagram2D.AxisX>
    <dxc:AxisX2D Visible="True">
        <dxc:AxisX2D.Label>
            <dxc:AxisLabel ElementTemplate="{StaticResource AxisXLabelTemplate}"/>
        </dxc:AxisX2D.Label>
    </dxc:AxisX2D>
</dxc:XYDiagram2D.AxisX>
See Also
[Tickmarks, Grid Lines, and Interlacing](/WPF/6337/controls-and-libraries/charts-suite/chart-control/axes/tickmarks-grid-lines-and-interlacing)
[How to: Sort Qualitative Scale Values in a Custom Sort Order](/WPF/115150/controls-and-libraries/charts-suite/chart-control/examples/providing-data/how-to-sort-qualitative-scale-values-in-a-custom-sort-order)
[How to: Customize Axis Labels](/WPF/7048/controls-and-libraries/charts-suite/chart-control/examples/appearance-customization/how-to-customize-axis-labels)
[How to: Create and Customize Custom Axis Labels](/WPF/17929/controls-and-libraries/charts-suite/chart-control/examples/chart-elements/how-to-create-and-customize-custom-axis-labels)
[How to: Configure Resolve Overlapping for Axis Labels](/WPF/117128/controls-and-libraries/charts-suite/chart-control/examples/chart-elements/how-to-configure-resolve-overlapping-for-axis-labels)