# Calculate Summaries | WPF Controls | DevExpress Documentation
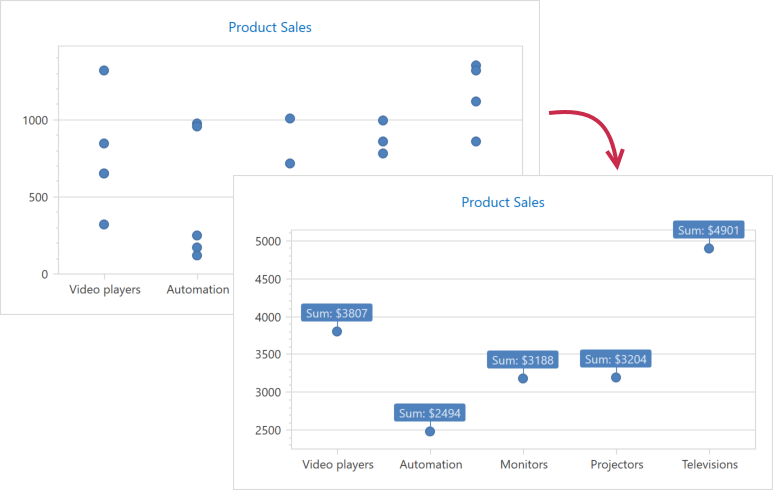
The Chart Control can apply a summary function to calculate data source value summaries and display them as [series points](/WPF/6340/controls-and-libraries/charts-suite/chart-control/series/series-points).
- Summary vs Aggregation
- Apply a Summary Function
- Numeric, Time-Span and Date-Time Axis Specifics
## Summary vs Aggregation
[Aggregation](/WPF/16846/controls-and-libraries/charts-suite/chart-control/data-aggregation) is similar to summaries but the Chart Control queries and stores data in memory differently.
| | Summary | Aggregation |
| --- | --- | --- |
| **Store Data** | Chart stores summarized values. | Chart stores raw data source values. |
| **Change Detail Level** | Chart re-loads data from the data source. | Chart re-calculates data in memory. |
| **Behave on Zoom** | Chart does not re-calculate aggregated values when it is zoomed. | Chart re-calculates value aggregates on each zoom level. |
| **Memory Consumption** | Low | High |
## Apply a Summary Function
- Initialize the [Series.Summary](/WPF/DevExpress.Xpf.Charts.Series.Summary) property with a new [Summary](/WPF/DevExpress.Xpf.Charts.Summary) object.
- Specify the [Summary.Function](/WPF/DevExpress.Xpf.Charts.Summary.Function) property. The following summary functions are available:
- [AverageSummaryFunction](/WPF/DevExpress.Xpf.Charts.AverageSummaryFunction) (“AVERAGE”)
- [CountSummaryFunction](/WPF/DevExpress.Xpf.Charts.CountSummaryFunction) (“COUNT”)
- [MaxSummaryFunction](/WPF/DevExpress.Xpf.Charts.MaxSummaryFunction) (“MAX”)
- [MinSummaryFunction](/WPF/DevExpress.Xpf.Charts.MinSummaryFunction) (“MIN”)
- [SumSummaryFunction](/WPF/DevExpress.Xpf.Charts.SumSummaryFunction) (“SUM”)
You can create summary functions if the predefined functions do not meet your requirements or a series type takes two or more value parameters (for example, the financial [Candle Stick](/WPF/6850/controls-and-libraries/charts-suite/chart-control/series/2d-series-types/financial-series/candle-stick) series).
- The “AVERAGE”, “MAX”, “MIN” and “SUM” functions require you to specify the [DataMemberSummaryFunction.ValueDataMember](/WPF/DevExpress.Xpf.Charts.DataMemberSummaryFunction.ValueDataMember) property. The Chart Control uses the [DataMemberSummaryFunction.ValueDataMember](/WPF/DevExpress.Xpf.Charts.DataMemberSummaryFunction.ValueDataMember) to calculate summary values even if the [Series.ValueDataMember](/WPF/DevExpress.Xpf.Charts.Series.ValueDataMember) property is set.
You can use Chart Designer or markup to apply a summary function.
Important
Automatic summary functions can be calculated only for [Series](/WPF/6339/controls-and-libraries/charts-suite/chart-control/series/series) that operate with [data points](/WPF/6340/controls-and-libraries/charts-suite/chart-control/series/series-points) with **one** value for each argument. If series data points have **two** or more values (e.g., [Range](/WPF/10632/controls-and-libraries/charts-suite/chart-control/series/2d-series-types/bar-series/side-by-side-range-bar), [Financial](/WPF/8351/controls-and-libraries/charts-suite/chart-control/series/2d-series-types/financial-series) and [Bubble](/WPF/5870/controls-and-libraries/charts-suite/chart-control/series/2d-series-types/point-line-and-bubble-series/bubble) series), you should use Custom Summary Functions instead.
Also note that a summary function cannot be calculated when an axis’s [scale mode](/WPF/115179/controls-and-libraries/charts-suite/chart-control/axes/axis-scale-types) is **Continuous**.
### Use the Chart Designer
- Run the [Chart Designer](/WPF/17445/controls-and-libraries/charts-suite/chart-control/chart-designer-for-developers).
- Use the Element Tree on the left to select a series. Then, open its **Properties** tab on the right.
- Click the **Summary** property’s [button](/WPF/15631/controls-and-libraries/property-grid/visual-elements/grid-menus) and select the **New Summary** item.

- Use the **Function** property menu to select a summary function.

- Type a name of the data source field that provides data for summarization.

- Click the **Save and Exit** button to save changes and close the designer.
### Use Markup
The following example shows how to apply the “SUM” function:
- XAML
- C#
- VB.NET
<Window.DataContext>
    <local:ChartViewModel/>
</Window.DataContext>
<Grid>
    <dxc:ChartControl>
        <dxc:XYDiagram2D SeriesItemsSource="{Binding SaleSeries}">
            <dxc:XYDiagram2D.SeriesItemTemplate>
                <DataTemplate>
                    <dxc:PointSeries2D DataSource="{Binding Values}"
                                       ArgumentDataMember="Category">
                        <!-- Configure the summary function options. -->
                        <dxc:PointSeries2D.Summary>
                            <dxc:Summary>
                                <dxc:Summary.Function>
                                    <dxc:SumSummaryFunction ValueDataMember="Value"/>
                                </dxc:Summary.Function>
                            </dxc:Summary>
                        </dxc:PointSeries2D.Summary>
                        <!--...-->
                        <dxc:PointSeries2D.Label>
                            <dxc:SeriesLabel Visible="True"
                                             TextPattern="Sum: ${V}M"
                                             dxc:MarkerSeries2D.Angle="90"
                                             ResolveOverlappingMode="JustifyAroundPoint"/>
                        </dxc:PointSeries2D.Label>
                    </dxc:PointSeries2D>
                </DataTemplate>
            </dxc:XYDiagram2D.SeriesItemTemplate>
            <!--...-->
        </dxc:XYDiagram2D>
        <!--...-->
    </dxc:ChartControl>
</Grid>
public class ChartViewModel {
    public IEnumerable<SaleSeries> SaleSeries { get; private set; }
    public ChartViewModel() {
        SaleSeries = new Collection<SaleSeries> {
        new SaleSeries {
            Values = new Collection<SaleInfo> {
                new SaleInfo { Category= "Video players", Region = "Asia",          Value = 853},
                new SaleInfo { Category= "Video players", Region = "Australia",     Value = 321},
                new SaleInfo { Category= "Video players", Region = "Europe",        Value = 655},
                new SaleInfo { Category= "Video players", Region = "North America", Value = 1325},
                new SaleInfo { Category= "Video players", Region = "South America", Value = 653},

                new SaleInfo { Category= "Automation", Region = "Asia",          Value = 172},
                new SaleInfo { Category= "Automation", Region = "Australia",     Value = 255},
                new SaleInfo { Category= "Automation", Region = "Europe",        Value = 981D},
                new SaleInfo { Category= "Automation", Region = "North America", Value = 963D},
                new SaleInfo { Category= "Automation", Region = "South America", Value = 123D},

                new SaleInfo { Category= "Monitors", Region = "Asia",          Value = 1011D},
                new SaleInfo { Category= "Monitors", Region = "Australia",     Value = 359D},
                new SaleInfo { Category= "Monitors", Region = "Europe",        Value = 721D},
                new SaleInfo { Category= "Monitors", Region = "North America", Value = 565D},
                new SaleInfo { Category= "Monitors", Region = "South America", Value = 532D},

                new SaleInfo { Category= "Projectors", Region = "Asia",          Value = 998D},
                new SaleInfo { Category= "Projectors", Region = "Australia",     Value = 222D},
                new SaleInfo { Category= "Projectors", Region = "Europe",        Value = 865D},
                new SaleInfo { Category= "Projectors", Region = "North America", Value = 787D},
                new SaleInfo { Category= "Projectors", Region = "South America", Value = 332D},

                new SaleInfo { Category= "Televisions", Region = "Asia",          Value = 1356D},
                new SaleInfo { Category= "Televisions", Region = "Australia",     Value = 232D},
                new SaleInfo { Category= "Televisions", Region = "Europe",        Value = 1323D},
                new SaleInfo { Category= "Televisions", Region = "North America", Value = 1125D},
                new SaleInfo { Category= "Televisions", Region = "South America", Value = 865D}
            }
        }
    };
    }
}
public class SaleSeries {
    public IEnumerable<SaleInfo> Values { get; set; }
}
public class SaleInfo {
    public string Category { get; set; }
    public string Region { get; set; }
    public double Value { get; set; }
}
Public Class ChartViewModel
    Public Property SaleSeries As IEnumerable(Of SaleSeries)

    Public Sub New()
        SaleSeries = New Collection(Of SaleSeries) From {
            New SaleSeries With {
                .Values = New Collection(Of SaleInfo) From {
                    New SaleInfo With { .Category = "Video players", .Region = "Asia", .Value = 853R },
                    New SaleInfo With { .Category = "Video players", .Region = "Australia", .Value = 321R },
                    New SaleInfo With { .Category = "Video players", .Region = "Europe", .Value = 655R },
                    New SaleInfo With { .Category = "Video players", .Region = "North America", .Value = 1325R },
                    New SaleInfo With { .Category = "Video players", .Region = "South America", .Value = 653R },
                    New SaleInfo With { .Category = "Automation", .Region = "Asia", .Value = 172R },
                    New SaleInfo With { .Category = "Automation", .Region = "Australia", .Value = 255R },
                    New SaleInfo With { .Category = "Automation", .Region = "Europe", .Value = 981R },
                    New SaleInfo With { .Category = "Automation", .Region = "North America", .Value = 963R },
                    New SaleInfo With { .Category = "Automation", .Region = "South America", .Value = 123R },
                    New SaleInfo With { .Category = "Monitors", .Region = "Asia", .Value = 1011R },
                    New SaleInfo With { .Category = "Monitors", .Region = "Australia", .Value = 359R },
                    New SaleInfo With { .Category = "Monitors", .Region = "Europe", .Value = 721R },
                    New SaleInfo With { .Category = "Monitors", .Region = "North America", .Value = 565R },
                    New SaleInfo With { .Category = "Monitors", .Region = "South America", .Value = 532R },
                    New SaleInfo With { .Category = "Projectors", .Region = "Asia", .Value = 998R },
                    New SaleInfo With { .Category = "Projectors", .Region = "Australia", .Value = 222R },
                    New SaleInfo With { .Category = "Projectors", .Region = "Europe", .Value = 865R },
                    New SaleInfo With { .Category = "Projectors", .Region = "North America", .Value = 787R },
                    New SaleInfo With { .Category = "Projectors", .Region = "South America", .Value = 332R },
                    New SaleInfo With { .Category = "Televisions", .Region = "Asia", .Value = 1356R },
                    New SaleInfo With { .Category = "Televisions", .Region = "Australia", .Value = 232R },
                    New SaleInfo With { .Category = "Televisions", .Region = "Europe", .Value = 1323R },
                    New SaleInfo With { .Category = "Televisions", .Region = "North America", .Value = 1125R },
                    New SaleInfo With { .Category = "Televisions", .Region = "South America", .Value = 865R }
                }
            }
        }
    End Sub
End Class

Public Class SaleSeries
    Public Property Values As IEnumerable(Of SaleInfo)
End Class

Public Class SaleInfo
    Public Property Category As String
    Public Property Region As String
    Public Property Value As Double
End Class
The example above uses the following API members to configure summary calculations:
| Member | Description |
| --- | --- |
| [Series.Summary](/WPF/DevExpress.Xpf.Charts.Series.Summary) | Gets or sets the series data point summarization settings. |
| [Summary](/WPF/DevExpress.Xpf.Charts.Summary) | Stores the series data point summarize options. |
| [Summary.Function](/WPF/DevExpress.Xpf.Charts.Summary.Function) | Specifies the summary function that calculates data point values. |
| [DataMemberSummaryFunction.ValueDataMember](/WPF/DevExpress.Xpf.Charts.DataMemberSummaryFunction.ValueDataMember) | Gets or sets the data source field that provides data to be aggregated. |
### Create a Custom Summary Function
The following example shows how to create the “Standard Deviation (STDEV.P)” summary function and apply it to chart data:
- XAML
- C#
- VB.NET
<Window.DataContext>
    <local:ChartViewModel/>
</Window.DataContext>
<Grid>
    <dxc:ChartControl>
        <dxc:XYDiagram2D SeriesItemsSource="{Binding SaleSeries}">
            <dxc:XYDiagram2D.SeriesItemTemplate>
                <DataTemplate>
                    <dxc:PointSeries2D DataSource="{Binding Values}"
                                       ArgumentDataMember="Category">
                        <!-- Configure the summary function options. -->
                        <dxc:PointSeries2D.Summary>
                            <dxc:Summary>
                                <dxc:Summary.Function>
                                    <local:StdDevSummaryFunction ValueDataMember="Value"/>
                                </dxc:Summary.Function>
                            </dxc:Summary>
                        </dxc:PointSeries2D.Summary>
                        <!--...-->
                    </dxc:PointSeries2D>
                </DataTemplate>
            </dxc:XYDiagram2D.SeriesItemTemplate>
            <!--...-->
        </dxc:XYDiagram2D>
        <!--...-->
    </dxc:ChartControl>
</Grid>
public class StdDevSummaryFunction : DataMemberSummaryFunction {
    public override string Name { get { return "STDEV"; } }

    protected override SeriesPoint[] CreateSeriesPoints(Series series, object argument, string[] functionArguments, DataSourceValues[] values, object[] colors) {
        double[] amount = new double[values.Length];
        double sum = 0.0;
        for(int i = 0; i < values.Length; i++) {
            amount[i] = Convert.ToDouble(values[i][functionArguments[0]]);
            sum += amount[i];
        }
        double averageAmount = sum / values.Length;
        double standardDeviationSquareSum = 0.0;
        for(int i = 0; i < values.Length; i++) {
            double deviation = amount[i] - averageAmount;
            standardDeviationSquareSum += deviation * deviation;
        }
        SeriesPoint seriesPoint = new SeriesPoint() { Argument = argument.ToString(), Value = Math.Round(Math.Sqrt(standardDeviationSquareSum / values.Length), 2) };
        return new SeriesPoint[] { seriesPoint };
    }
}
Public Class StdDevSummaryFunction
    Inherits DataMemberSummaryFunction
    Public Overrides ReadOnly Property Name As String
        Get
            Return "STDDEV"
        End Get
    End Property
    Protected Overrides Function CreateSeriesPoints(ByVal series As Series, ByVal argument As Object, ByVal functionArguments As String(), ByVal values As DataSourceValues(), ByVal colors As Object()) As SeriesPoint()
        Dim amount As Double() = New Double(values.Length - 1) {}
        Dim sum As Double = 0.0
        For i As Integer = 0 To values.Length - 1
            amount(i) = Convert.ToDouble(values(i)(functionArguments(0)))
            sum += amount(i)
        Next
        Dim averageAmount As Double = sum / values.Length
        Dim standardDeviationSquareSum As Double = 0.0
        For i As Integer = 0 To values.Length - 1
            Dim deviation As Double = amount(i) - averageAmount
            standardDeviationSquareSum += deviation * deviation
        Next
        Dim seriesPoint As SeriesPoint = New SeriesPoint() With {
            .Argument = argument.ToString(),
            .Value = Math.Round(Math.Sqrt(standardDeviationSquareSum / values.Length), 2)
        }
        Return New SeriesPoint() {seriesPoint}
    End Function
End Class
## Numeric, Time-Span and Date-Time Axis Specifics
For numerical, time-span and date-time x-axis [scales](/WPF/115179/controls-and-libraries/charts-suite/chart-control/axes/axis-scale-types), the summary function aggregates data point values for each interval the **MeasureUnit** ([NumericSummaryOptions.MeasureUnit](/WPF/DevExpress.Xpf.Charts.NumericSummaryOptions.MeasureUnit), [TimeSpanSummaryOptions.MeasureUnit](/WPF/DevExpress.Xpf.Charts.TimeSpanSummaryOptions.MeasureUnit) or [DateTimeSummaryOptions.MeasureUnit](/WPF/DevExpress.Xpf.Charts.DateTimeSummaryOptions.MeasureUnit)) property specifies.
The following images illustrate how changes to the measurement unit affect point summaries:
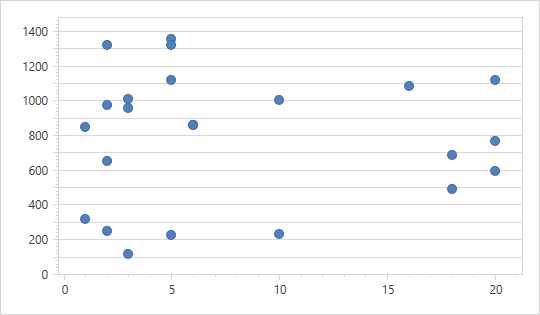A summary function is not applied.
 is applied. \[NumericSummaryOptions.MeasureUnit\](xref:DevExpress.Xpf.Charts.NumericSummaryOptions.MeasureUnit) = 1 ](/WPF/images/chart-control/summary-measurement-unit-1.png)[AverageSummaryFunction](/WPF/DevExpress.Xpf.Charts.AverageSummaryFunction) is applied. [NumericSummaryOptions.MeasureUnit](/WPF/DevExpress.Xpf.Charts.NumericSummaryOptions.MeasureUnit) = 1
 is applied. \[NumericSummaryOptions.MeasureUnit\](xref:DevExpress.Xpf.Charts.NumericSummaryOptions.MeasureUnit) = 5 ](/WPF/images/chart-control/summary-measurement-unit-5.png)[AverageSummaryFunction](/WPF/DevExpress.Xpf.Charts.AverageSummaryFunction) is applied. [NumericSummaryOptions.MeasureUnit](/WPF/DevExpress.Xpf.Charts.NumericSummaryOptions.MeasureUnit) = 5
The following example shows how to change a measurement unit used to calculate numeric x-axis arguments:
- XAML
- C#
- VB.NET
<Window.DataContext>
    <local:ChartViewModel/>
</Window.DataContext>
<Grid>
    <dxc:ChartControl>
        <dxc:XYDiagram2D>
            <dxc:PointSeries2D DataSource="{Binding Data}"
                               ArgumentDataMember="Argument">
                <!-- Configure the summary function options. -->
                <dxc:PointSeries2D.Summary>
                    <dxc:Summary>
                        <dxc:Summary.Function>
                            <dxc:AverageSummaryFunction ValueDataMember="Value"/>
                        </dxc:Summary.Function>
                        <dxc:Summary.NumericSummaryOptions>
                            <dxc:NumericSummaryOptions MeasureUnit="5"/>
                        </dxc:Summary.NumericSummaryOptions>
                    </dxc:Summary>
                </dxc:PointSeries2D.Summary>
                <!--...-->
            </dxc:PointSeries2D>
    </dxc:ChartControl>
</Grid>
public class ChartViewModel {
    public IEnumerable<DataPoint> Data { get; private set; }
    public ChartViewModel() {
        Data = new Collection<DataPoint> {
            new DataPoint { Argument= 1, Value = 853D},
            new DataPoint { Argument= 1, Value = 321D},
            new DataPoint { Argument= 2, Value = 655D},
            new DataPoint { Argument= 2, Value = 1325D},
            new DataPoint { Argument= 2, Value = 255D},
            new DataPoint { Argument= 2, Value = 981D},
            new DataPoint { Argument= 3, Value = 963D},
            new DataPoint { Argument= 3, Value = 123D},
            new DataPoint { Argument= 3, Value = 1011D},
            new DataPoint { Argument= 5, Value = 1356D},
            new DataPoint { Argument= 5, Value = 232D},
            new DataPoint { Argument= 5, Value = 1323D},
            new DataPoint { Argument= 5, Value = 1125D},
            new DataPoint { Argument= 6, Value = 865D},
            new DataPoint { Argument= 6, Value = 865D},
            new DataPoint { Argument= 10, Value = 1006D},
            new DataPoint { Argument= 10, Value = 236D},
            new DataPoint { Argument= 16, Value = 1090D},
            new DataPoint { Argument= 18, Value = 496D},
            new DataPoint { Argument= 18, Value = 691D},
            new DataPoint { Argument= 20, Value = 1125D},
            new DataPoint { Argument= 20, Value = 600D},
            new DataPoint { Argument= 20, Value = 770D}
        };
    }
}
public class DataPoint {
    public double Argument { get; set; }
    public double Value { get; set; }
}
Public Class ChartViewModel
    Public Property Data As IEnumerable(Of DataPoint)
    Public Sub New()
        Data = New Collection(Of DataPoint) From {
            New DataPoint With {.Argument = 1, .Value = 853R},
            New DataPoint With {.Argument = 1, .Value = 321R},
            New DataPoint With {.Argument = 2, .Value = 655R},
            New DataPoint With {.Argument = 2, .Value = 1325R},
            New DataPoint With {.Argument = 2, .Value = 255R},
            New DataPoint With {.Argument = 2, .Value = 981R},
            New DataPoint With {.Argument = 3, .Value = 963R},
            New DataPoint With {.Argument = 3, .Value = 123R},
            New DataPoint With {.Argument = 3, .Value = 1011R},
            New DataPoint With {.Argument = 5, .Value = 1356R},
            New DataPoint With {.Argument = 5, .Value = 232R},
            New DataPoint With {.Argument = 5, .Value = 1323R},
            New DataPoint With {.Argument = 5, .Value = 1125R},
            New DataPoint With {.Argument = 6, .Value = 865R},
            New DataPoint With {.Argument = 6, .Value = 865R},
            New DataPoint With {.Argument = 10, .Value = 1006R},
            New DataPoint With {.Argument = 10, .Value = 236R},
            New DataPoint With {.Argument = 16, .Value = 1090R},
            New DataPoint With {.Argument = 18, .Value = 496R},
            New DataPoint With {.Argument = 18, .Value = 691R},
            New DataPoint With {.Argument = 20, .Value = 1125R},
            New DataPoint With {.Argument = 20, .Value = 600R},
            New DataPoint With {.Argument = 20, .Value = 770R}
        }
    End Sub
End Class
Public Class DataPoint
    Public Property Argument As Double
    Public Property Value As Double
End Class