# Selection | WPF Controls | DevExpress Documentation
Use the mouse or touch gestures on touchscreen devices to select series and series points.

## Selection Mode
The [ChartControl.SelectionMode](/WPF/DevExpress.Xpf.Charts.ChartControl.SelectionMode) property value defines whether you can select chart elements. When this property’s value is set to **None** (default value), end users cannot select a chart’s elements. The [ElementSelectionMode](/WPF/DevExpress.Xpf.Charts.ElementSelectionMode) enumeration lists all the selection modes. To enable selection, set the **SelectionMode** property to one of the following modes:
| Mode | Example | Description |
| --- | --- | --- |
| Single | 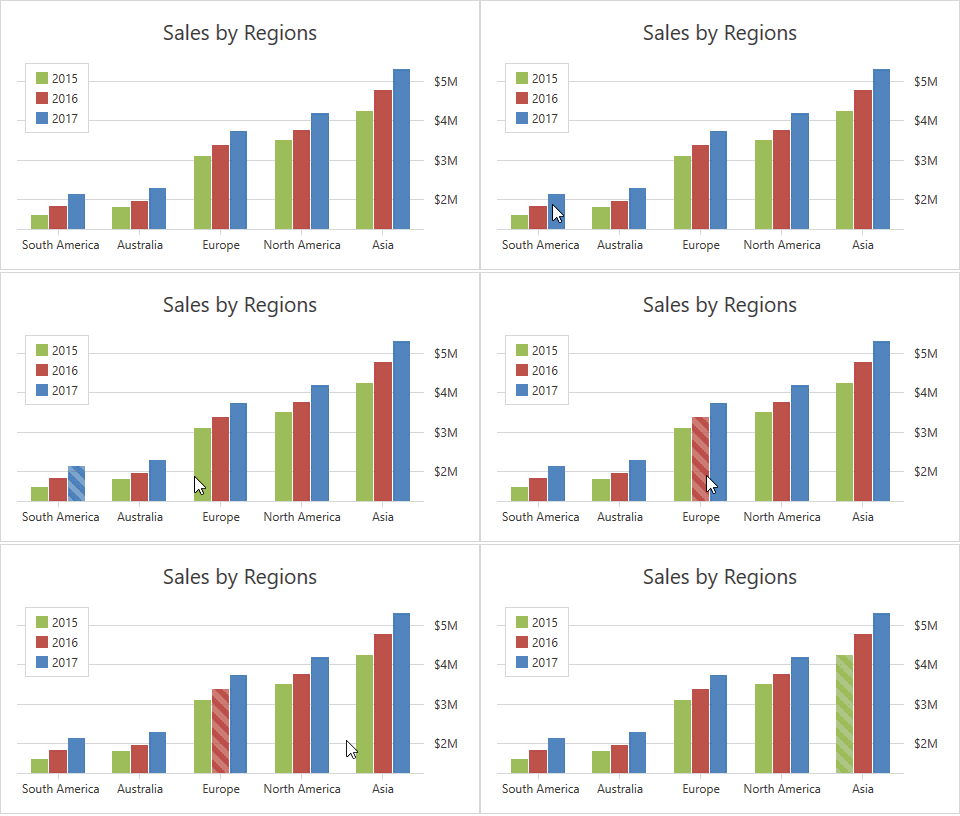 | Only one series element can be selected. Click or tap a series element to select it.
Set the [ChartControl.SelectionMode](/WPF/DevExpress.Xpf.Charts.ChartControl.SelectionMode) property to **ElementSelectionMode.Single** to enable this mode. |
| Multiple | 
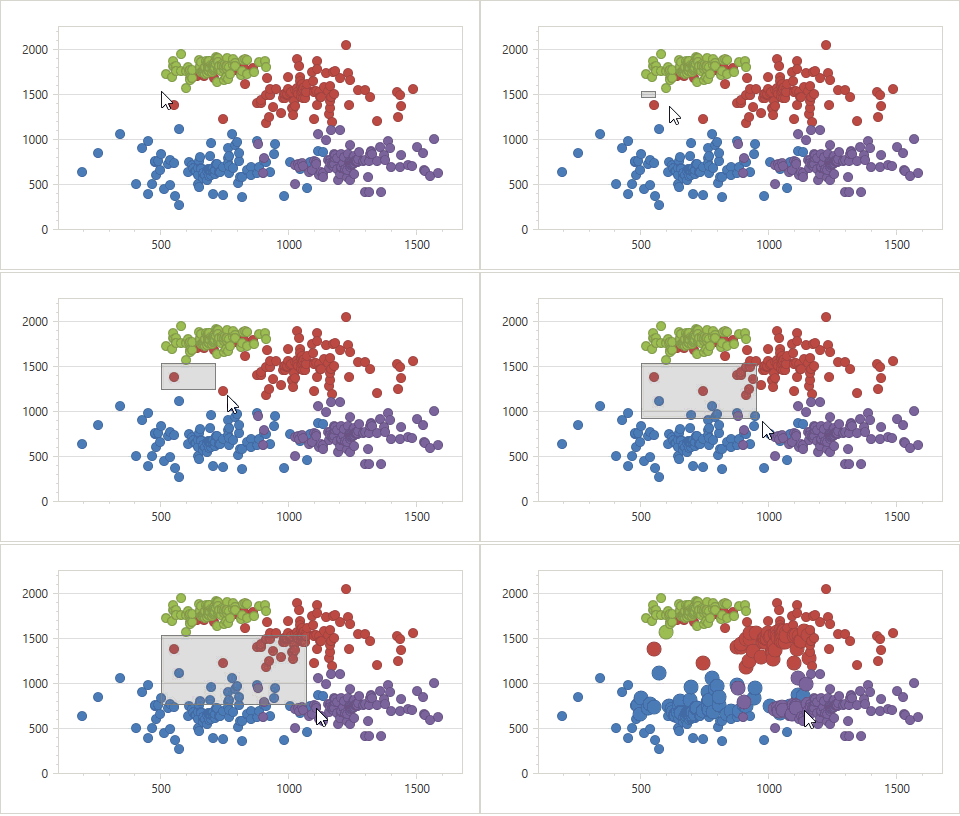 | You can select multiple series elements simultaneously. Click or tap a series element to select it. Hold Ctrl and click a series element to deselect it.
In this mode, you can also use the Selection Rectangle to select multiple series’s elements. Move the mouse pointer while the Ctrl key and the left mouse button are pressed to mark series elements to be selected.
Set the [ChartControl.SelectionMode](/WPF/DevExpress.Xpf.Charts.ChartControl.SelectionMode) property to **ElementSelectionMode.Multiple** to enable this mode. |
| Extended | 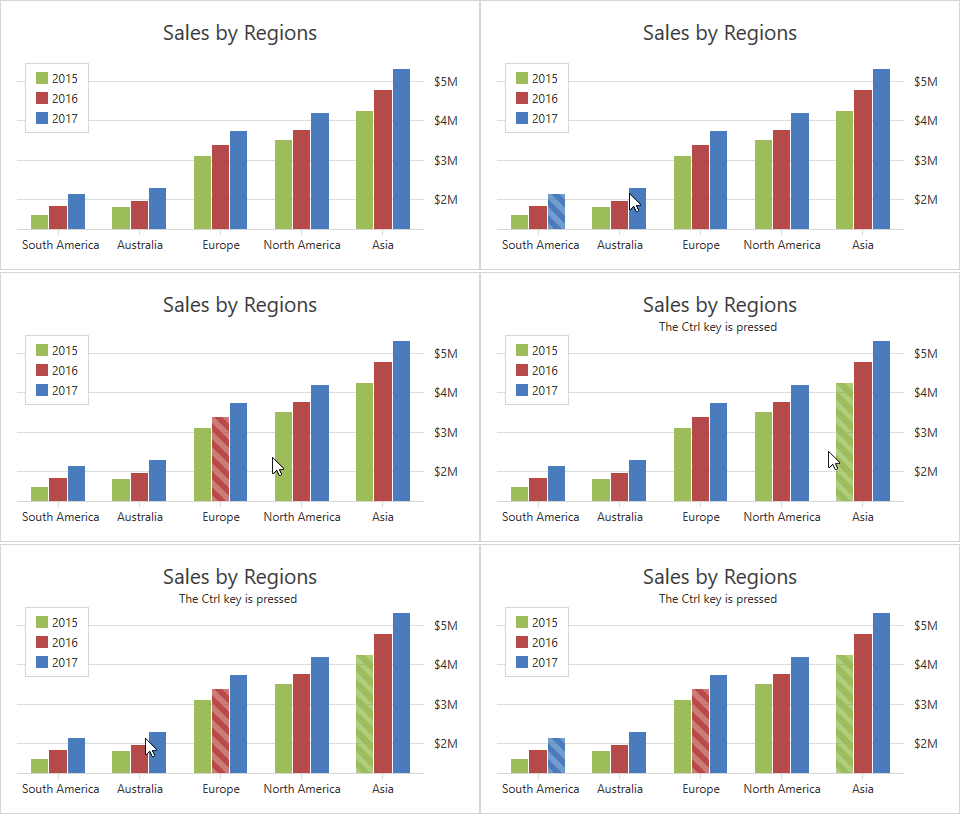 | The Extended mode combines the Single and Multiple selection modes’ behaviors.
- Click an element to select it.
- To select/deselect multiple elements, click them while the Ctrl key is pressed.
Set the [ChartControl.SelectionMode](/WPF/DevExpress.Xpf.Charts.ChartControl.SelectionMode) property to **ElementSelectionMode.Extended** to enable this mode. |
## Series Selection Mode
The [ChartControl.SeriesSelectionMode](/WPF/DevExpress.Xpf.Charts.ChartControl.SeriesSelectionMode) property specifies a series element that is selected when you click a series point. The [SeriesSelectionMode](/WPF/DevExpress.Xpf.Charts.SeriesSelectionMode) enumeration contains all possible modes.
| Mode | Example | Description |
| --- | --- | --- |
| Point (default mode) |  | You can select only one series point at a time.
Set the [ChartControl.SeriesSelectionMode](/WPF/DevExpress.Xpf.Charts.ChartControl.SeriesSelectionMode) property to **SeriesSelectionMode.Point** to enable this mode. |
| Argument |  | This mode allows you to select points with the same argument simultaneously.
Set the [ChartControl.SeriesSelectionMode](/WPF/DevExpress.Xpf.Charts.ChartControl.SeriesSelectionMode) property to **SeriesSelectionMode.Argument** to enable this mode. |
| Series |  | In this mode, click a series point to select the entire series.
Set the [ChartControl.SeriesSelectionMode](/WPF/DevExpress.Xpf.Charts.ChartControl.SeriesSelectionMode) property to **SeriesSelectionMode.Series** to enable this mode. |
## Access the Selected Elements
Use the [ChartControl.SelectedItem](/WPF/DevExpress.Xpf.Charts.ChartControl.SelectedItem) or [ChartControl.SelectedItems](/WPF/DevExpress.Xpf.Charts.ChartControl.SelectedItems) properties to access the selected elements.
- XAML
<dxc:ChartControl SelectionMode="Single"
                  SelectedItem="{Binding Path=SelectedCountry, Mode=TwoWay}">
        <!-- Other Chart Control's settings. -->
</dxc:ChartControl>
## Specify Selection Rectangle’s Appearance
Assign a **DataTemplate** object to the [XYDiagram2D.SelectionTemplate](/WPF/DevExpress.Xpf.Charts.XYDiagram2D.SelectionTemplate) property to specify the Selection Rectangle’s appearance:
- XAML
<dxc:XYDiagram2D EnableAxisXNavigation="True"
                 EnableAxisYNavigation="True">
    <dxc:XYDiagram2D.SelectionTemplate>
        <DataTemplate>
            <Border BorderThickness="1" BorderBrush="Gray">
                <Rectangle Opacity="0.3" Fill="Gray"/>
            </Border>
        </DataTemplate>
    </dxc:XYDiagram2D.SelectionTemplate>
    <!--...-->
</dxc:XYDiagram2D>
## Customize the Appearance of Selected Series Points
Use a [custom series model](/WPF/4285/controls-and-libraries/charts-suite/chart-control/series/series-and-marker-models#custom-model-for-series) to change the appearance of selected series points.
To change the color of selected series points, follow the steps below:
- Implement a custom model of a particular series ([CustomBar2DModel](/WPF/DevExpress.Xpf.Charts.CustomBar2DModel) in the example below).
- Create a [ControlTemplate](https://learn.microsoft.com/dotnet/api/system.windows.controls.controltemplate) object and assign it to the [CustomBar2DModel.PointTemplate](/WPF/DevExpress.Xpf.Charts.CustomBar2DModel.PointTemplate) property.
- Create the **IsSelectedToBrushConverter** class that implements the [IValueConverter](https://learn.microsoft.com/dotnet/api/system.windows.data.ivalueconverter) interface and contains the **Convert** and **ConvertBack** methods. The **Convert** method returns different colors for selected and unselected series points.
- Bind the **Border.Background** property to the **IsSelected** property and use the **IsSelectedToBrushConverter** object to convert the **IsSelected** value to a color.
- XAML
 <Window.Resources>
        <ResourceDictionary>
            <local:IsSelectedToBrushConverter x:Key="isSelectedConverter"/>
        </ResourceDictionary>
    </Window.Resources>
    <Grid>
        <dxc:ChartControl  SelectionMode="Multiple"  CrosshairEnabled="False">
            <dxc:ChartControl.Diagram>
                <dxc:XYDiagram2D>
                    <dxc:XYDiagram2D.Series>
                        <dxc:BarSideBySideSeries2D>
                            <dxc:BarSideBySideSeries2D.Model>
                                <dxc:CustomBar2DModel>
                                    <dxc:CustomBar2DModel.PointTemplate>
                                        <ControlTemplate>
                                            <Border Background="{Binding IsSelected, Converter={StaticResource isSelectedConverter}}"/>
                                        </ControlTemplate>
                                    </dxc:CustomBar2DModel.PointTemplate>
                                </dxc:CustomBar2DModel>
                            </dxc:BarSideBySideSeries2D.Model>
                            <!--...-->
                        </dxc:BarSideBySideSeries2D>
                    </dxc:XYDiagram2D.Series>
                </dxc:XYDiagram2D>
            </dxc:ChartControl.Diagram>
        </dxc:ChartControl>
    </Grid>
</Window>
- C#
- VB.NET
 public class IsSelectedToBrushConverter : IValueConverter {

    public object Convert(object value, System.Type targetType, object parameter, CultureInfo culture) {
        if (value is bool && targetType == typeof(Brush)) {
            bool isSelected = (bool)value;
            return isSelected ? Brushes.Black : Brushes.Red;
        }
        return null;
    }

    public object ConvertBack(object value, System.Type targetType, object parameter, CultureInfo culture) {
        throw new System.NotImplementedException();
    }
}
Public Class IsSelectedToBrushConverter
    Inherits IValueConverter

    Public Function Convert(ByVal value As Object, ByVal targetType As System.Type, ByVal parameter As Object, ByVal culture As CultureInfo) As Object
        If TypeOf value Is Boolean AndAlso targetType = GetType(Brush) Then
            Dim isSelected As Boolean = CBool(value)
            Return If(isSelected, Brushes.Black, Brushes.Red)
        End If

        Return Nothing
    End Function

    Public Function ConvertBack(ByVal value As Object, ByVal targetType As System.Type, ByVal parameter As Object, ByVal culture As CultureInfo) As Object
        Throw New System.NotImplementedException()
    End Function
End Class
[View Example: How to customize the appearance of selected series points](https://github.com/DevExpress-Examples/wpf-chart-customize-the-appearance-of-selected-series-points)
See Also
[How to: Implement Selection in the MVVM Style](/WPF/115265/controls-and-libraries/charts-suite/chart-control/examples/end-user-interaction/how-to-implement-selection-in-the-mvvm-style)