XRPivotGrid Class
Displays multi-dimensional data in reports.
Namespace: DevExpress.XtraReports.UI
Assembly: DevExpress.XtraReports.v23.2.dll
NuGet Package: DevExpress.Reporting.Core
Declaration
public class XRPivotGrid :
    XRControl,
    IDataContainer,
    IDataSourceAssignable,
    IDataContainerBase,
    IEffectiveDataContainer,
    IPivotGridEventsImplementorBase,
    IPivotGridPrinterOwner,
    IBasePrintable,
    IComponentLoading,
    IBindingList,
    IList,
    ICollection,
    IEnumerable,
    ITypedList,
    IPivotGrid,
    IChartDataSource,
    IPivotGridDataContainer,
    IPivotGridDataContainerCore,
    IXtraSerializableLayoutEx,
    IXtraSupportDeserializeCollection,
IComplexControlRemarks
The XRPivotGrid control duplicates all the general functionality of the PivotGridControl and allows you to display a pivot table in a report.
Display in the Toolbox
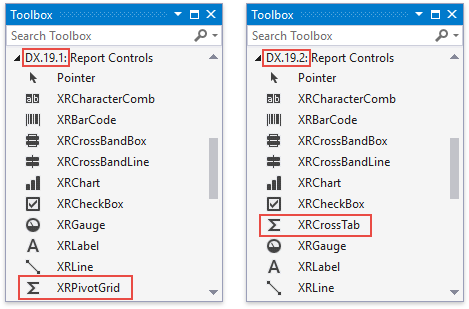
Starting with v19.2, the XRPivotGrid control is not available in the Toolbox. We recommend that you try the new XRCrossTab control instead.
The XRPivotGrid control is configured via the separate Designer outside the report context and requires that you write code in many popular scenarios.
The XRCrossTab control resolves certain XRPivotGrid‘s limitations and introduces the following design-time capabilities:
- define a cross-tab layout right on the report surface without invoking a separate designer window;
- access the most frequently used properties in smart tags;
- use expression bindings to calculate and conditionally format any cell value;
- filter data based on report parameter values;
- specify odd and even styles;
- customize appearance settings and assign styles for every visual element individually;
- rotate the cell text (for instance, make vertical headers);
- enable automatic column width calculation;
- customize the text in the top left corner;
- hide individual totals, headers, and any columns/rows.
Tip
See the Convert to the Cross Tab Control section for information on how to migrate your XRPivotGrid control.
If you still want to use the XRPivotGrid control and display it in the Toolbox instead of the XRCrossTab control, invoke the Report Designer Options dialog and set the DefaultCrossTabControl option to XRPivotGrid.

Add to Report and Bind to Data
Open a report and drop the
XRPivotGridcontrol from the Toolbox onto the report’s Detail band.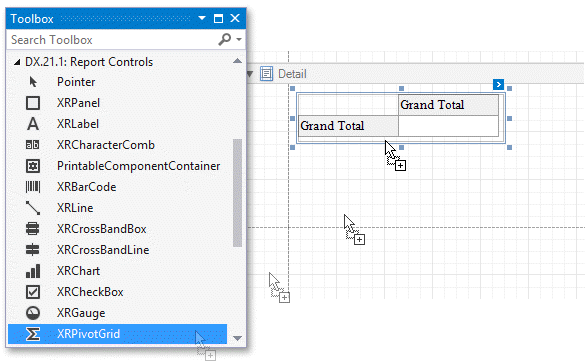
You cannot place a Pivot Grid in another report control (for instance, XRTableCell or XRPanel) because its width cannot be determined at design time.
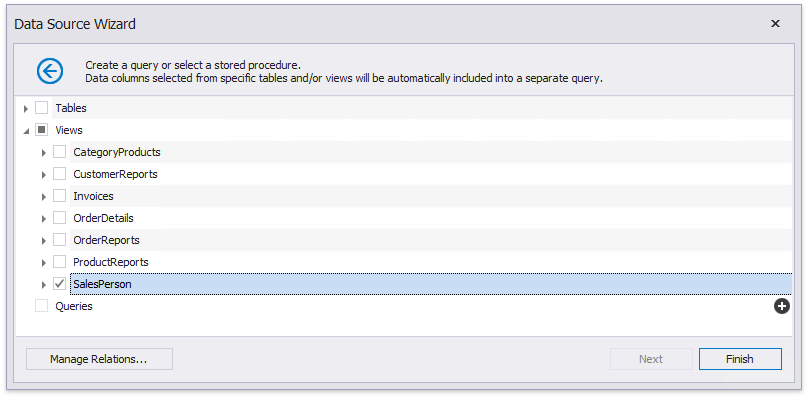
Click the created control’s smart tag, expand the XRPivotGrid.DataSource property’s drop-down list and click Add Report Data Source.
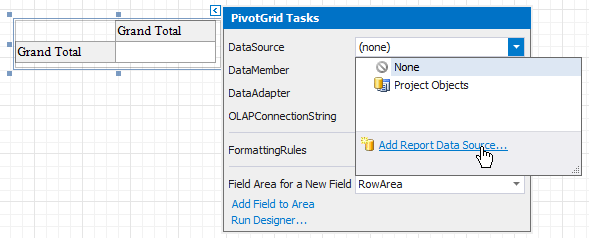
Follow the steps in the invoked Data Source Wizard to bind the Pivot Grid to data. You can bind it to the SalesPerson view of the sample Northwind database.
Note
Ensure that a report’s XtraReportBase.DataSource property is not set if you place the Pivot Grid in the Detail band. Otherwise, the Pivot Grid data is printed as many times as there are rows in the report data source.
Define the Layout
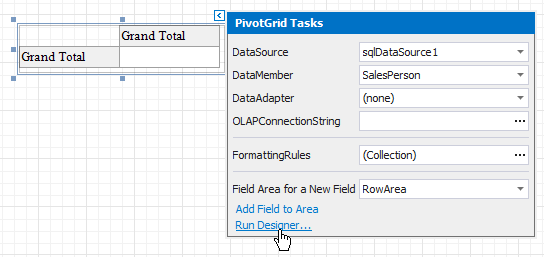
Click the control’s smart tag and select Run Designer in the invoked actions list.
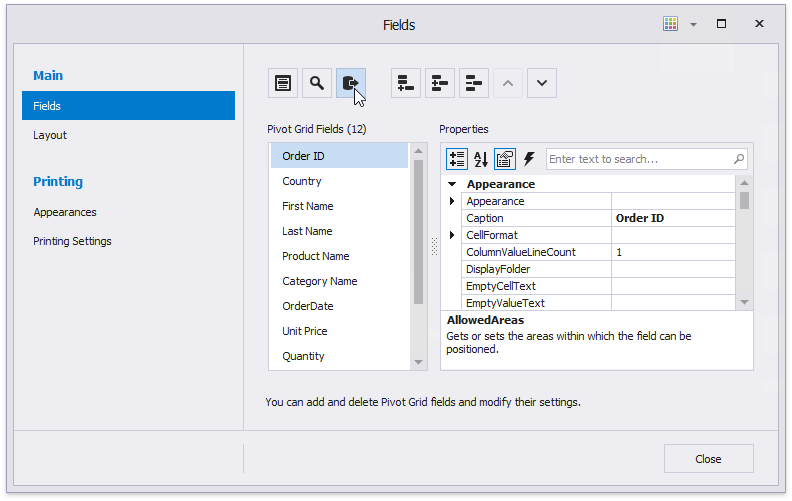
In the Pivot Grid Designer’s Fields page, click the Retrieve Fields button to obtain fields from the control’s data source.
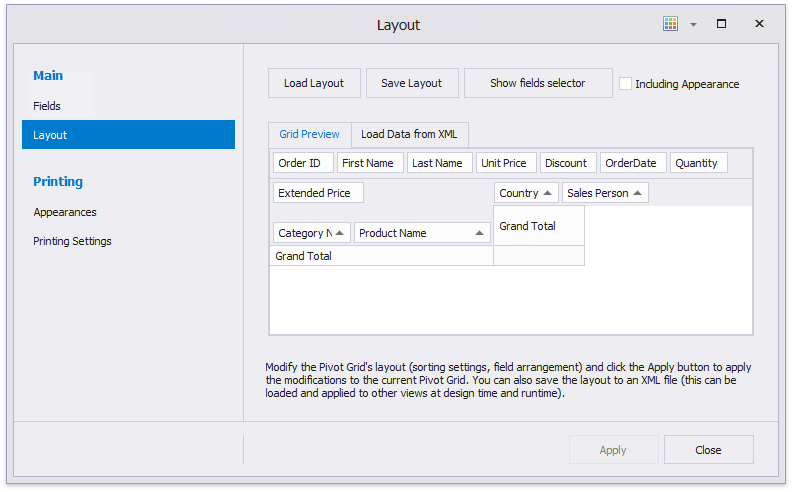
Switch to the Layout page in the navigation bar on the left and drag-and-drop data fields onto the appropriate areas to define the Pivot Grid’s layout. For instance, you can drag and drop the following fields:
- the CategoryName and ProductName fields onto the Row Fields area;
- the Country and SalesPerson fields onto the Column Fields area;
- the ExtendedPrice field onto the Data Items area.
Click Apply to apply the changes and close the Designer.
Tip
To see how the Pivot Grid looks when it is populated with data, switch to the report’s Preview.
Return to the Report Designer and invoke the Pivot Grid Designer. The pivot grid fields are now populated with actual data, and you can customize the grid.
Adjust the Layout Settings
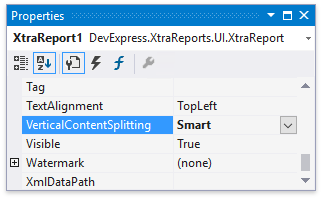
Set the report’s XtraReport.VerticalContentSplitting property to Smart to split the Pivot Grid along the column borders if it does not fit the report’s page in Print Preview.
You can adjust a column’s width to fit its content. To do this, handle the Pivot Grid’s XRControl.BeforePrint event and call the XRPivotGridField.BestFit method at runtime. You can also use the XRPivotGrid.BestFit method to resize all the columns that correspond to the data and row fields to display all their content.
using System.Drawing.Printing;
// ...

private void xrPivotGrid1_BeforePrint(object sender, CancelEventArgs e) {
    xrPivotGrid1.BestFit(fieldProductName1);
}
Specify Print Options
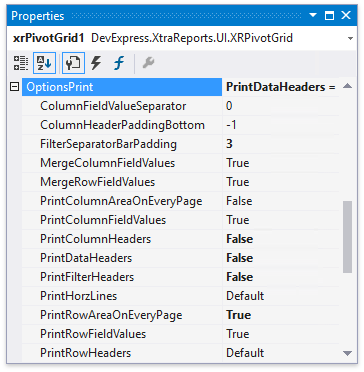
Use the XRPivotGrid.OptionsPrint property to specify print options and define which Pivot Grid elements are printed.
Disable the PivotGridOptionsPrint.PrintDataHeaders and PivotGridOptionsPrint.PrintFilterHeaders settings to not print data fields and filter fields’ headers.
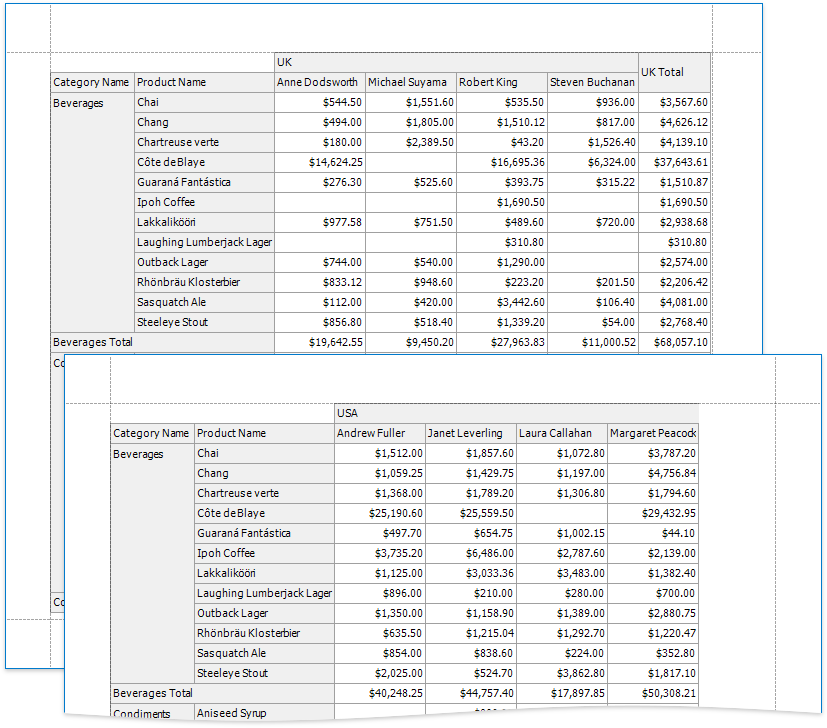
Enable the PivotGridOptionsPrint.PrintRowAreaOnEveryPage option to repeat row headers on each document page when the Pivot Grid’s layout is divided horizontally across several pages.
You can now preview the report. Swicth to the Preview tab in Visual Studio.
Use More Options
Refer to the WinForms Pivot Grid documentation for more information about the core Pivot Grid functionality.
See Integrate the WinForms Chart with the Pivot Grid Control for information on how to use a Pivot Grid as a Chart’s data source.
Convert to the Cross Tab Control
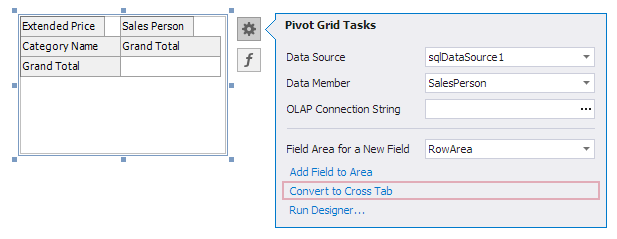
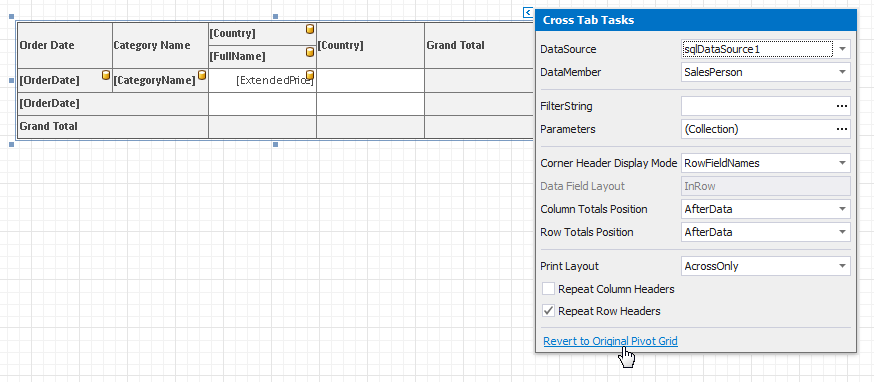
To migrate an existing Pivot Grid control to a new Cross Tab control, click the Pivot Grid’s smart tag and select Convert to Cross Tab.
Note that the Cross Tab does not support specific Pivot Grid functionality:
- The Cross Tab cells cannot display pictures (both static and dynamic);
- The Chart control cannot use the Cross Tab as a data source;
- The Cross Tab does not support data headers that are used to manage location of data field headers;
- The Cross Tab does not support the Pivot Grid’s predefined aggregate functions.
If the conversion result does not suit your requirements, you can restore the Pivot Grid. Click the Cross Tab’s smart tag and select Revert to Original Pivot Grid.
Filter Pivot Grid Data
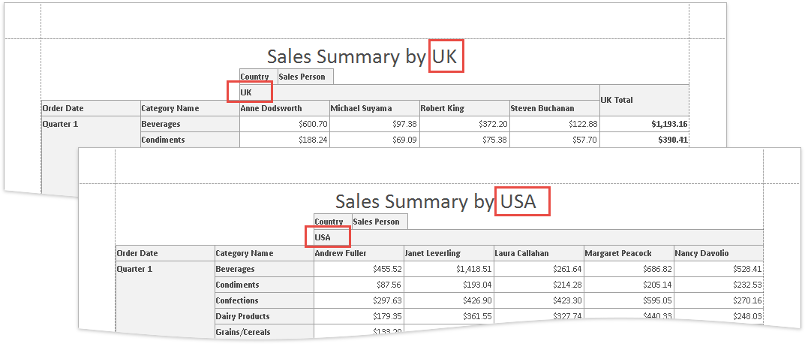
This example demonstrates how to use the GetCurrentColumnValue<T>(String) method to filter Pivot Grid data.
The example assumes that your report is bound to the SalesPerson view of the Northwind database. The report data is grouped against the Country column. The Group Header band contains the XRLabel and the XRPivotGrid control. The label displays the current country, the Pivot Grid displays information about sales in this country.
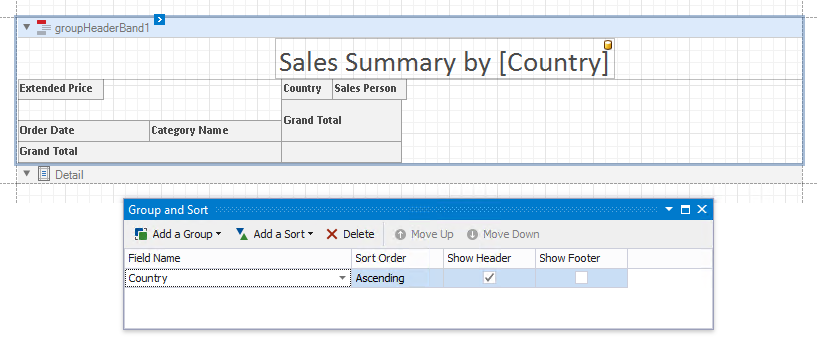
When you open the above report’s Preview, the Pivot Grid displays sales information for all countries in each group.
The following code sample filters Pivot Grid data agains the Country column.
using DevExpress.Data.Filtering;
// ...
        private void xrPivotGrid1_BeforePrint(object sender, System.ComponentModel.CancelEventArgs e) {
            // Retrieve the "Country" column's current value.
            string country = GetCurrentColumnValue<string>("Country");

            // Filter the Pivot Grid by the retrieved value.
            xrPivotGrid1.Prefilter.Criteria = new BinaryOperator(
                new OperandProperty("Country"),
                new ConstantValue(country),
                BinaryOperatorType.Equal);
        }
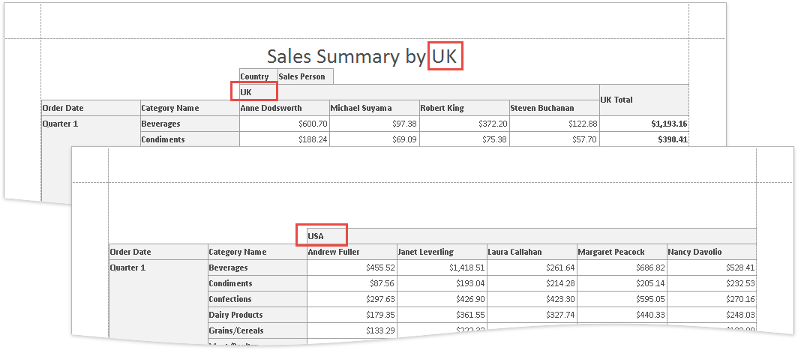
After the filter is applied, each group displays sales information only about one country.