Lesson 2 - Create a Data-Aware Report
- 3 minutes to read
This tutorial will guide you through the process of creating a data-aware report in a Silverlight application created with Visual Studio. You will learn how to bind a report to data, use the Field List to add report controls to a report and bind them to data, and also how to number pages in a report.
In this tutorial, we will use the report created in the preceding lesson: Lesson 1 - Create a Static Report.
Perform the actions below to bind a report to data in a Silverlight application.
Bind a Report to Data
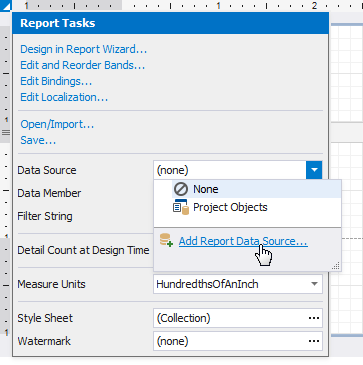
In Visual Studio, switch to the report designer and click the report’s smart tag. In its actions list, expand the drop-down list for the XtraReportBase.DataSource property and choose Add Report Data Source…
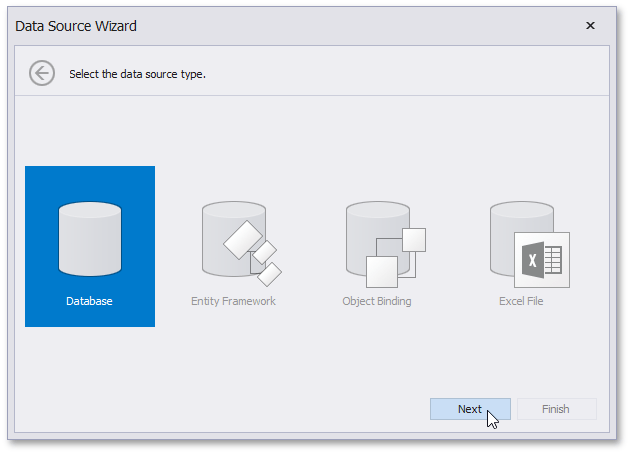
On the first page of the invoked wizard, choose Database and click Next.
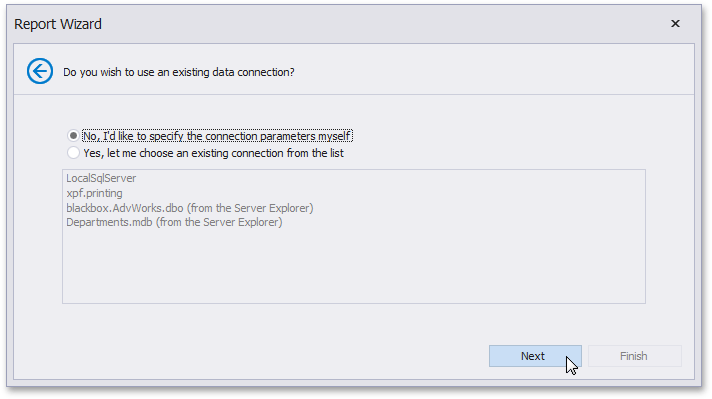
The next page allows you to specify whether you want to use an existing data connection or create a new data connection. Select “No, create a new connection“ and click Next.
On the next page, you can define a custom connection string, or select it from the supported data source types. Depending on the data provider selected, it may be necessary to specify additional connection options (such as authentication type and database name) on this page.
In this example, a report will be bound to data from the Categories data table of the Northwind database (the nwind.mdb file located in the directory where you installed the DevExpress demos).
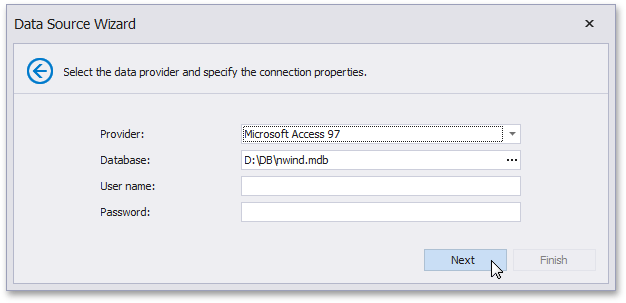
To proceed to the next wizard page, click Next.
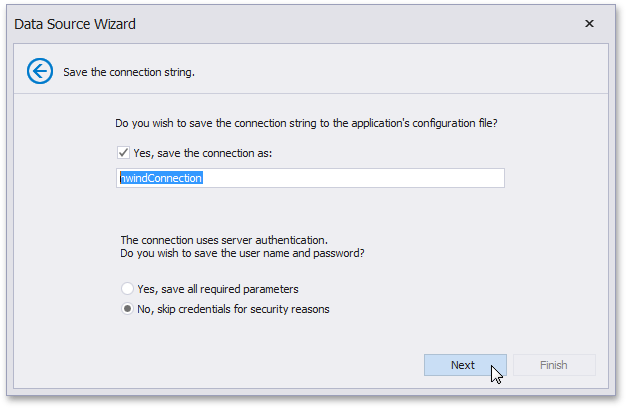
Click Next on the following page to save the created connection string to a configuration file.
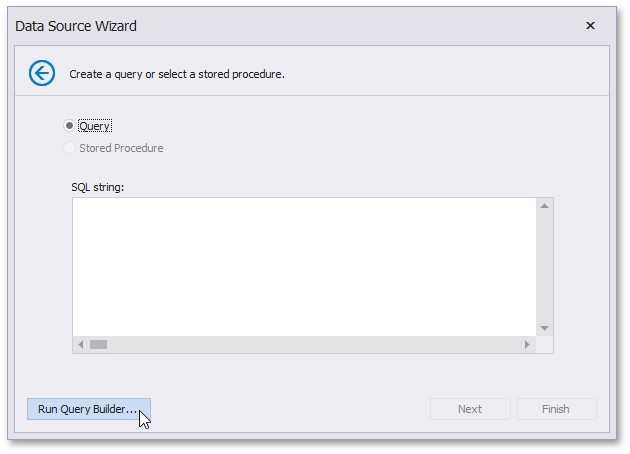
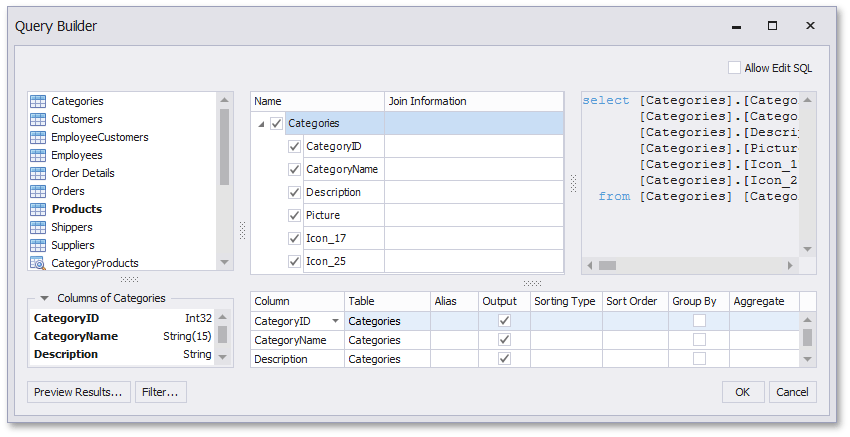
On the next page, you can construct an SQL query to obtain data from the database or select a stored procedure. Click Run Query Designer… to construct an SQL query.
In the invoked Query Designer window, drag the Categories item from the list of available tables on the left and drop it onto the list of data tables to be used.
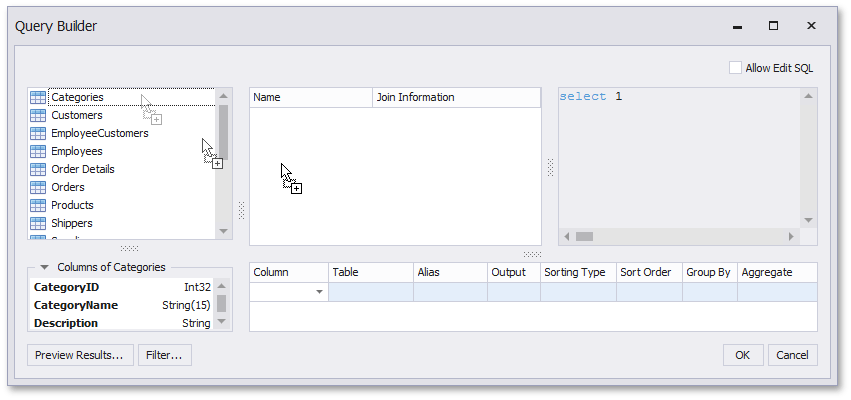
Enable the check box for the Categories table to include all of its fields in the view and click OK to exit the Query Designer. Click Finish in the Data Source Wizard to exit the wizard.
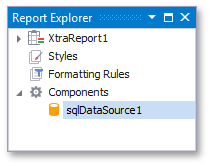
The newly created SQL data source will be displayed in the Components node of the Report Explorer. Additionally, the hierarchy of the data source will be reflected by the Field List.
Adjust the Report’s Content
To add data-aware controls to your report, do the following.
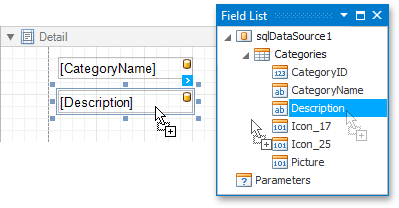
To create two data-aware labels that will obtain their content dynamically from the CategoryName and Description data fields, simply drop these fields from Field List onto the report’s Detail band.
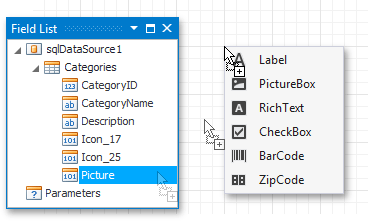
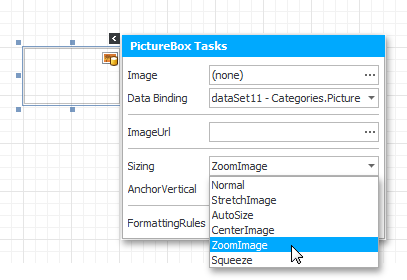
When dragging a field with a right-click, you can choose what control to create. This way we create an XRPictureBox bound to the Picture field, which is illustrated in the following image.
To specify the sizing mode of the image that picture box displays, use the control’s smart tag to set the XRPictureBox.Sizing property (e.g., to ZoomImage so that the image is resized proportionally).
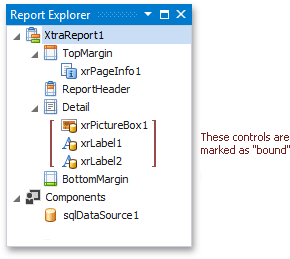
The Report Explorer panel reflects the structure of the created report, and data-aware controls are marked with yellow database icons.
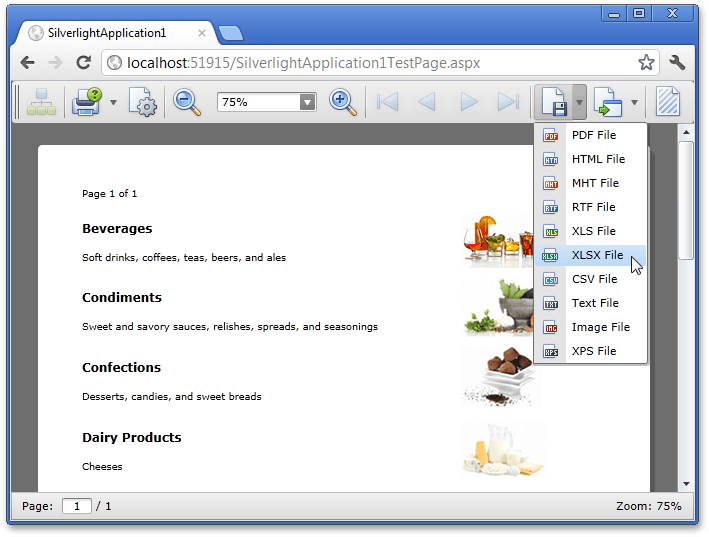
View the Result
The data-aware report is ready. Run the Silverlight application to view the result.