Debug Scripts in Visual Studio
This topic describes how to use the Visual Studio debugger to validate scripts in the End-User Report Designer. Visual Studio Express editions do not support this feature because they do not provide the Attach to Process option.
Important
Report scripts are not secure. We recommend that you use expression bindings instead.
Do the following to debug scripts in Visual Studio:
Open the configuration file of the application that contains the End-User Report Designer and add the <system.diagnostics> section as shown below:
<?xml version="1.0" encoding="utf-8"?>
<configuration>
    ...
  <system.diagnostics>
    <switches>
      <add name="AllowDebugXtraReportScripts" value="BreakWhenDebuggerAttached"/>
    </switches>
  </system.diagnostics>
</configuration>
Run this application.
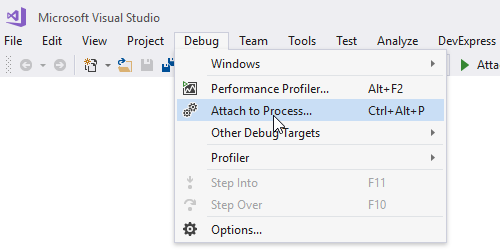
Start Visual Studio and select Debug | Attach to Process in the toolbar.
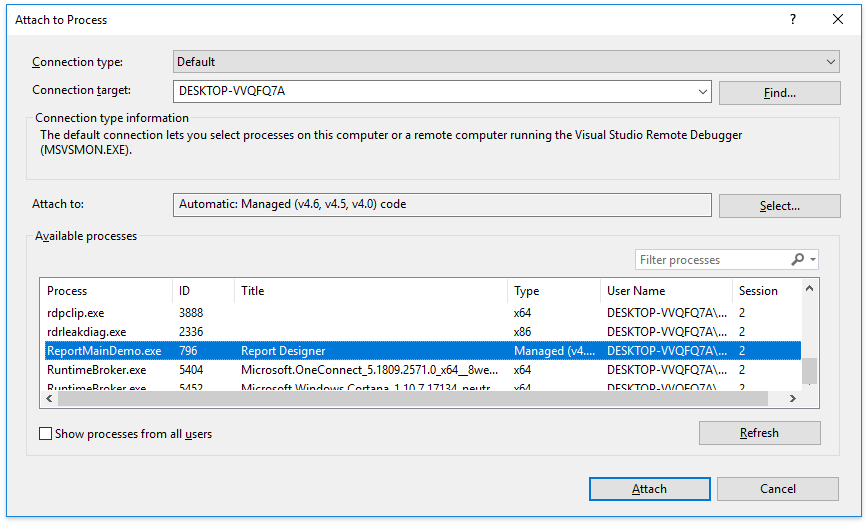
Select your running application in the invoked Attach to Process dialog.
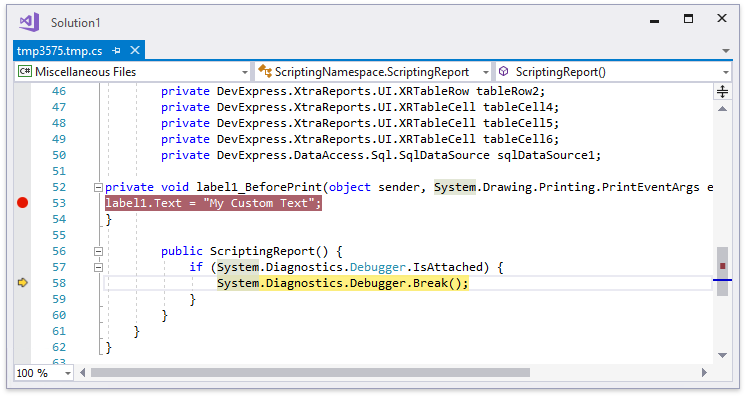
Return to the application with the End-User Report Designer and switch to the Preview tab. This opens the temporary generated class with all report elements and script code in Visual Studio. You can then debug the script code (for instance, use breakpoints).
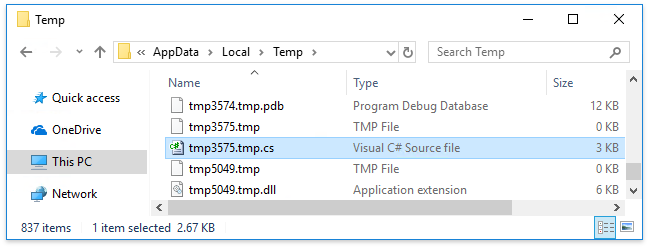
You can find this temporary created file in the following directory: C:\Users\User_Name\AppData\Local\Temp.