Bind a Report to Multiple Data Tables
- 2 minutes to read
This tutorial illustrates the capability to include data from two (or more) non-linked data tables into a single report.
Tip
In this tutorial, the data tables are obtained from the same data source. To learn how to bind a report to different data sources, see Bind a Report to Multiple Data Sources.
To display multiple data tables in the same report document, do the following.
Create a new application or open an existing application.
- Add a new blank report to it.
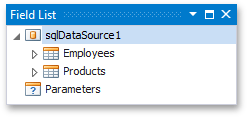
Add a dataset to the project, which uses two non-linked tables, e.g., the “Employees” and “Products” tables of the sample Northwind database.
Note
Make sure that data source of the report itself is not assigned. If it is not empty, you should manually reset the report’s XtraReportBase.DataSource and XtraReportBase.DataMember properties, since similar properties are to be assigned individually for the DetailReportBands.
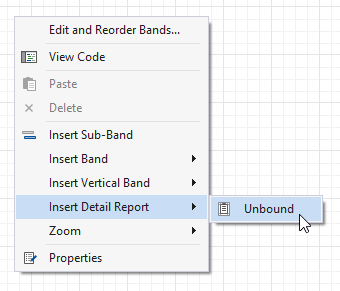
To add a DetailReportBand instance, right-click anywhere over the report’s surface, and select Insert Detail Report | Unbound in the invoked popup menu.
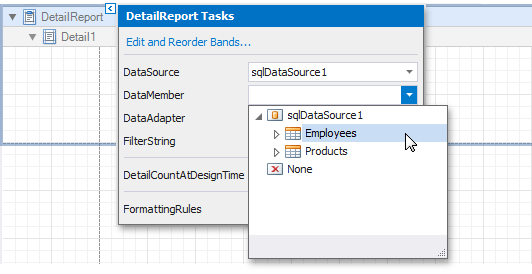
Next, assign a data source to the created Detail Report. To do this, click the Detail Report’s smart tag, and in the invoked actions list, set the DataSource property to the required data source.
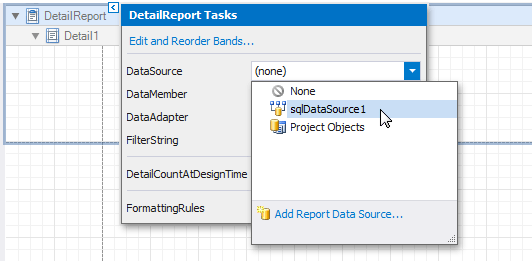
Likewise, define the band’s XtraReportBase.DataMember property to the “Employees” data table.
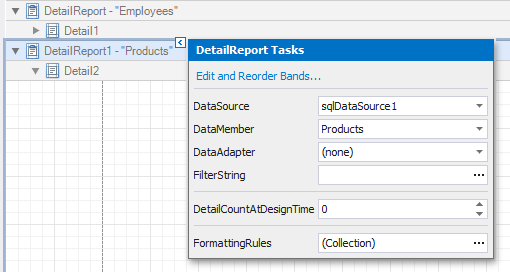
In a similar way, create another DetailReportBand (it should be created at the same level as the first Detail Report, and not nested into it).
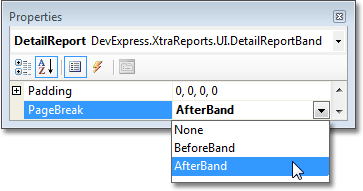
To force a page break between Detail Reports, set the Band.PageBreak property of the first DetailReportBand to AfterBand.
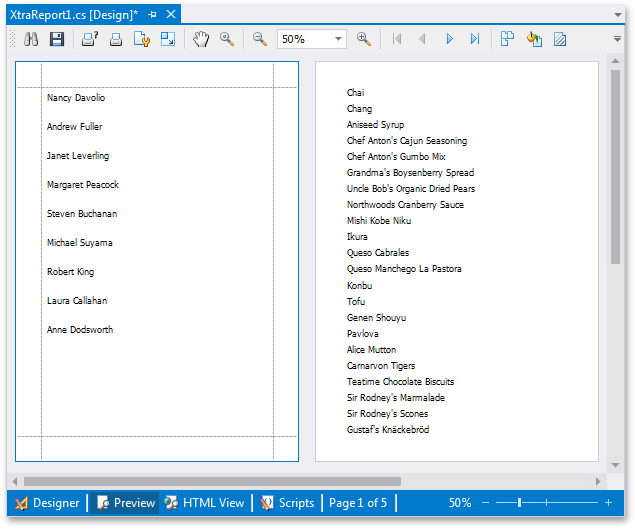
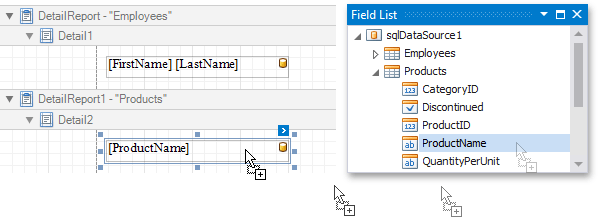
Finally, drag-and-drop the required data fields from the appropriate tables in the Field List onto the respective bands to create the bands’ actual content. For example:
The report is now ready. Switch to the Preview tab and view the result.