Calculate a Summary
- 3 minutes to read
This document shows how to use summary functions to calculate a group summary. For more information on summary functions, review the following help topic: Summaries Overview.
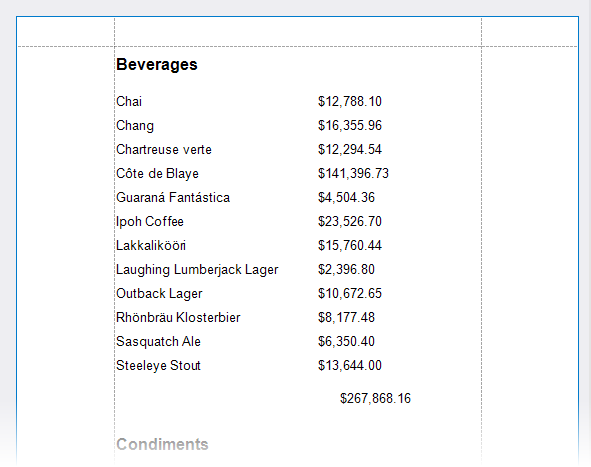
The following images show a sample report with a summary:
Follow the steps below to create a sample report with a summary.
Bind a Report to Data
Add a new blank report to the project. Review the following help topic for details: Create a Report in Visual Studio.
Click Add Report Data Source in the report’s smart tag to invoke the Data Source Wizard, as illustrated in the following image:

Create a data source and bind it to the SalesByCategory view from the `sample Northwind database.
Review the following help topic for more information on how to create a data source: Data Source Wizard.
Install the System.Data.SQLite.Core NuGet package to use the SQLite database.
Group Data by Category
Use the Group and Sort panel to create a Group Header band associated with the
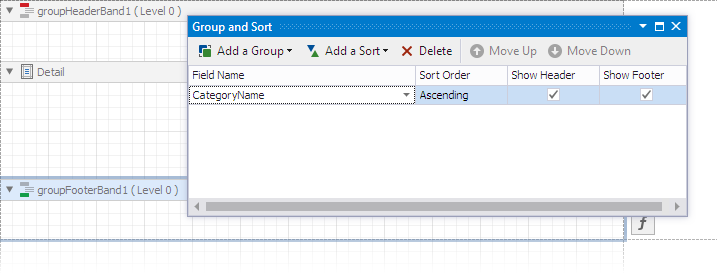
CategoryNamefield. If the panel is hidden, click Group and Sort in the XtraReports menu:
To create grouping criteria, click Add a Group and select the
CategoryNamefield from the invoked drop-down menu: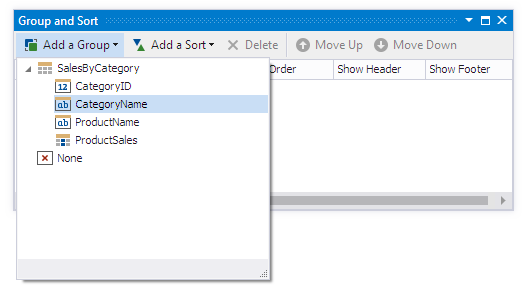
Select the Show Footer checkbox in the Group and Sort panel to add the Group Footer band:
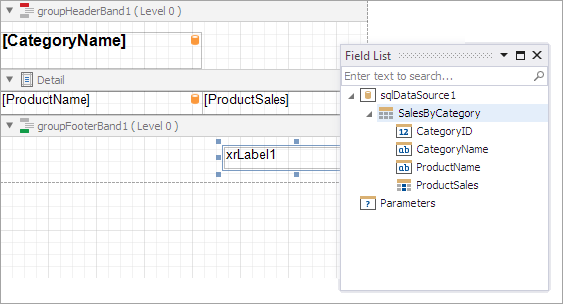
Add Report Controls to Display Data
Click Field List in the Visual Studio XtraReports menu to invoke the Field List panel. Drop fields from the Field List panel to the report bands as follows:
CategoryNamefield to the Group Header band.ProductNameandProductSalesfields to the Detail band.
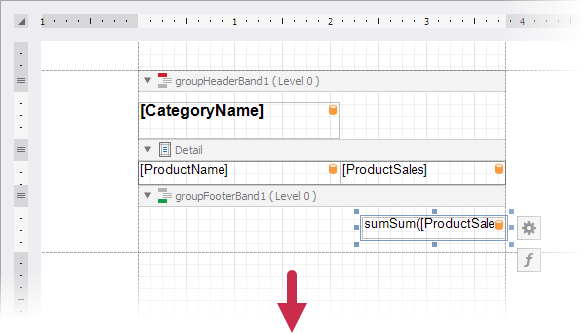
Drop the XRLabel control onto the Group Footer band:
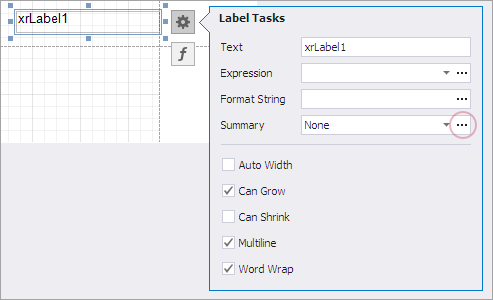
Add a Summary
Click the label’s smart tag. Then click the ellipsis next to the Summary editor to invoke the Summary Editor dialog.
The Summary Editor dialog allows you to specify the following options:
- Summary running — specifies summary calculation range (the entire report, current report group, or current document page).
- Summary function — specifies a summary function. When you hover over the information symbol, it shows a tooltip with information about the selected function.
- Argument expression — specifies a data field or a complex expression.
Review the following topic for a complete list of supported summary functions: Functions in Expressions.
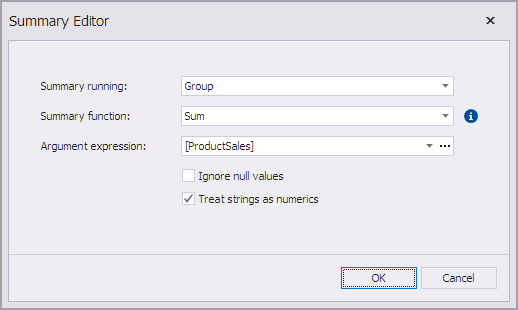
Select Sum as the summary function, Group as the calculation range, and ProductSales as the data field. Click OK to apply the settings.
The Summary Editor assigns an expression to the XRLabel’s Expression editor:
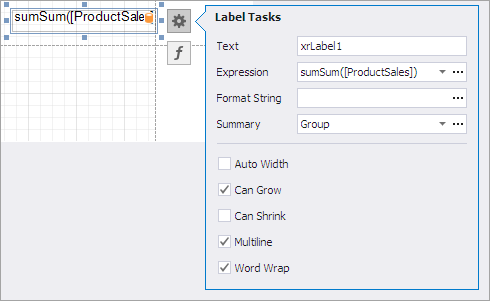
You can click the ellipsis next to the Expression editor to invoke the Expression Editor dialog:
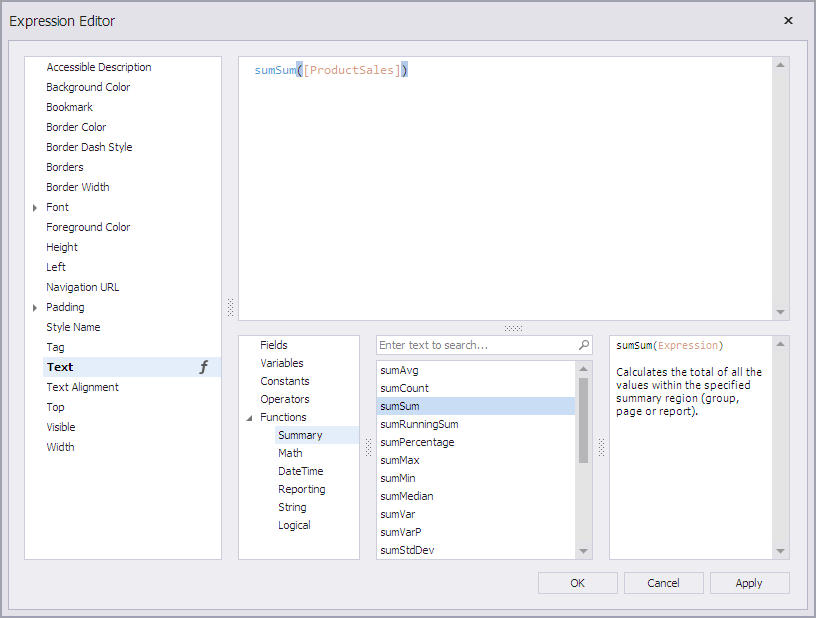
The dialog allows you to edit the summary expression and change the summary function. For the current example, no changes are required. Click OK to close the dialog window.
Switch to the Preview tab to see the resulting report.