Create a Multi-Column Report
- 3 minutes to read
This document describes how to arrange report data in multiple columns, which can be used to create mailing labels, business cards or multi-column directories.
Introduction
The following images illustrate different multi-column report layouts.
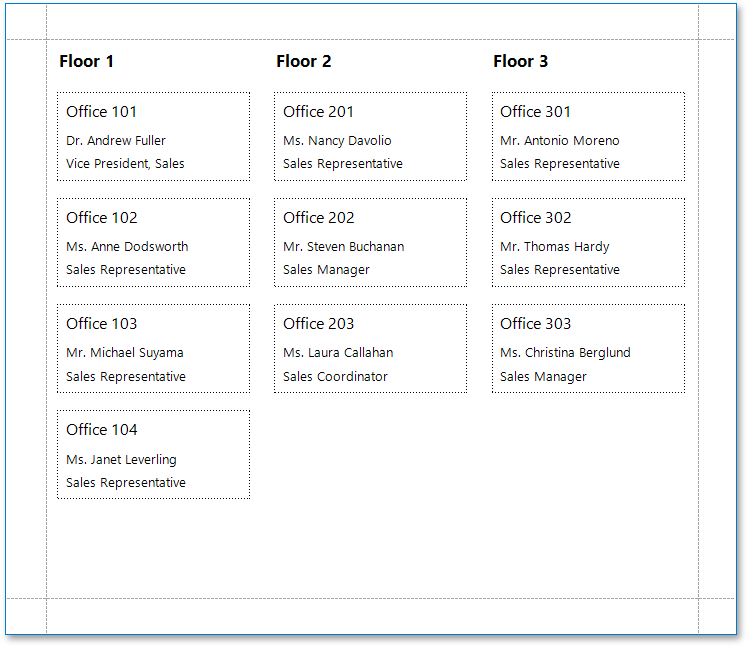
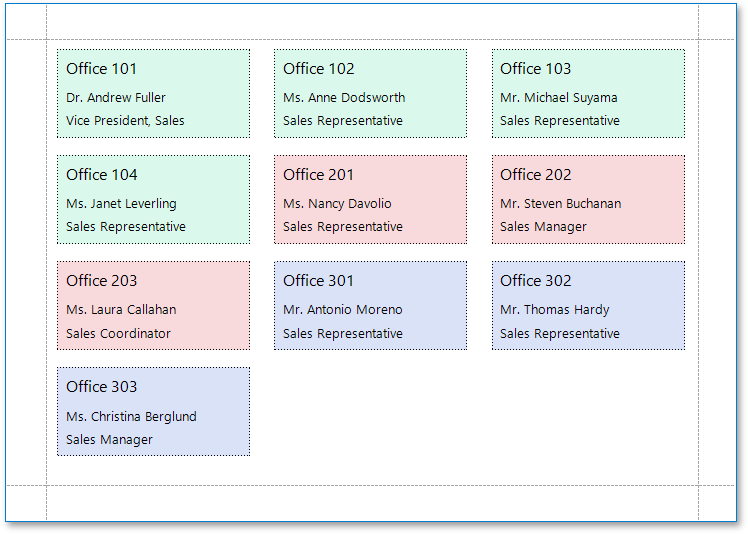
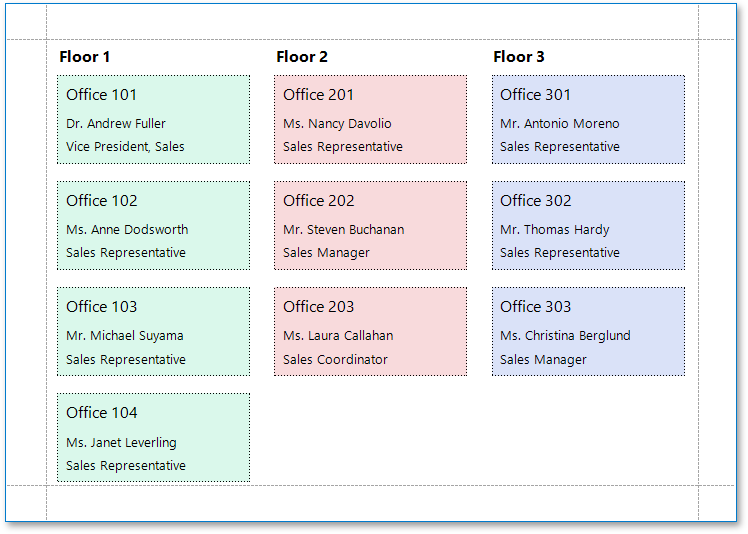
Down Then Across
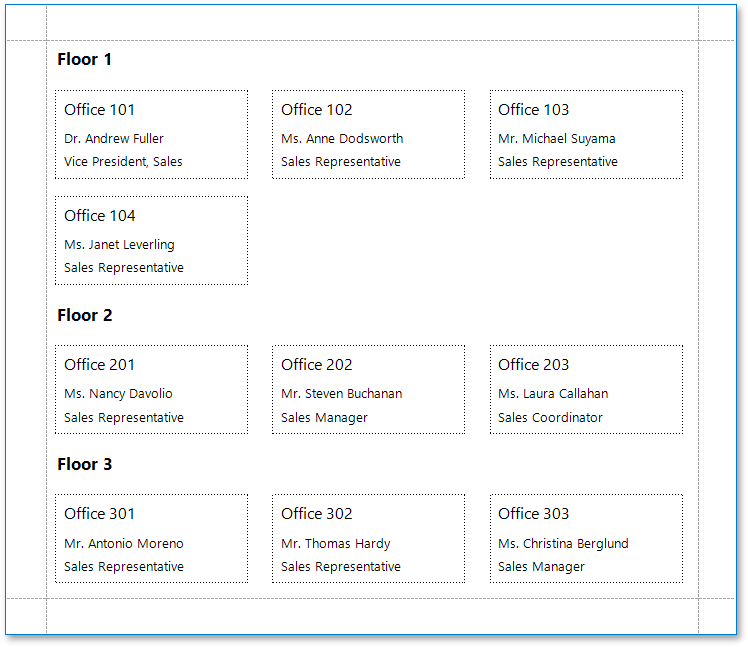
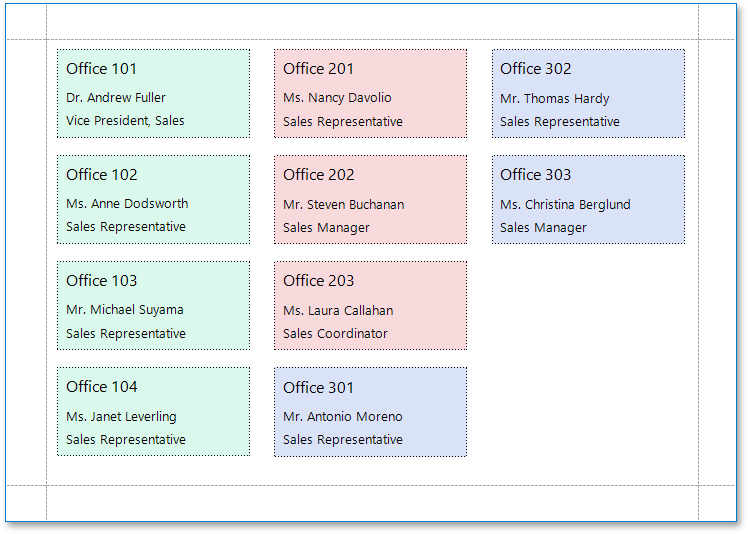
Across Then Down
As opposed to side-by-side reports that are mainly used to display content from different data sources, multi-column reports enable you to arrange content from a single data source.
To quickly create labels of standard sizes, you can also use the Label Wizard.
For a corresponding online demo, see Multi-Column Report.
Settings
To access the multi-column settings of a report’s Detail band, use its smart tag or the Properties window.
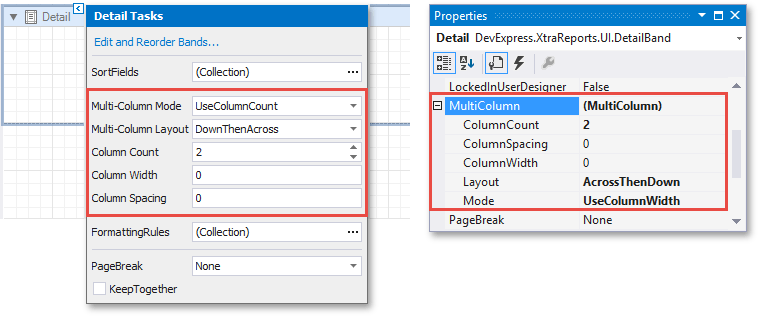
The DetailBand.MultiColumn property provides access to the following multi-column settings of the Detail band.
Setting | Description |
|---|---|
Enables you to select one of the following modes.
| |
Specifies the distance between adjacent columns. This value is measured in report units. | |
Specifies the preferred direction for arranging report data within columns.
|
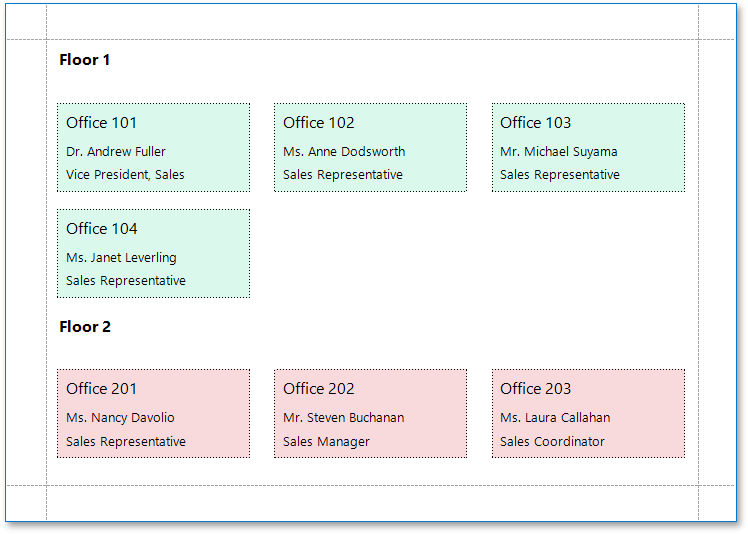
How It Works
The following image illustrates a report designer with a multi-column layout applied to the report.
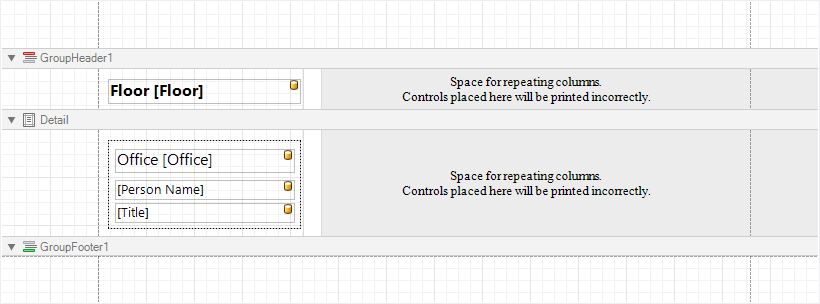
In multi-column mode, the report’s design surface is limited to the area defined by the column width. This is the only area intended to contain report controls.
The rest of this surface defines the space on a page remaining for printing columns and column spacing area.
In the above image, the report data in the Detail band is contained within a Panel that provides borders around the enclosed content.
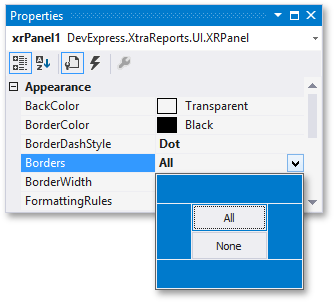
You can also specify a custom background color for the Panel. To learn how to change this color dynamically (based on the report’s underlying data), see Conditionally Change a Control’s Appearance.
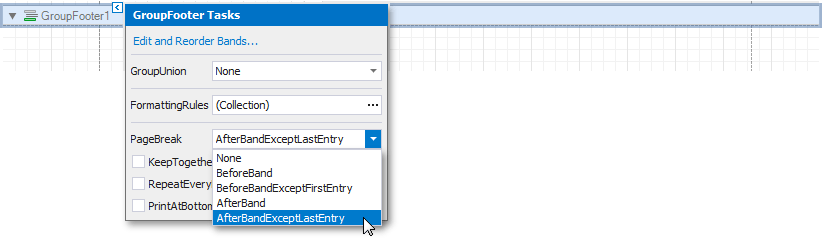
When the report data is grouped (as in the above image), and the down-then-across multi-column layout is used, you can make each group start on a new column. To do this, set the Band.PageBreak property of the Group Footer to PageBreak.AfterBand or PageBreak.AfterBandExceptLastEntry. When there is no data to display in the Group Footer, set the band height to zero.