Create a Master-Detail Report with Detail Report Bands
- 2 minutes to read
This tutorial illustrates how to display hierarchical data in a master-detail report using nested Detail Report bands. This approach is effective if your data source contains an ADO.NET master-detail relationship. Another way is described at Create a Master-Detail Report with Subreports.
Tip
To get started with this tutorial, open an existing reporting application or create a new application (the Add a Report to Your .NET Application section explains how to create a reporting application on different platforms).
Do the following to create a master-detail report:
Add a SQL data source and provide it with a master-detail relationship as described in the Bind a Report to a Database topic. In this example, we will use the Categories and Products data tables of the Northwind database (the nwind.mdb file located in the directory where you installed the DevExpress demos) to establish the Categories-Products master-detail relationship.
The Field List will be updated to reflect the new hierarchy of the report’s data.

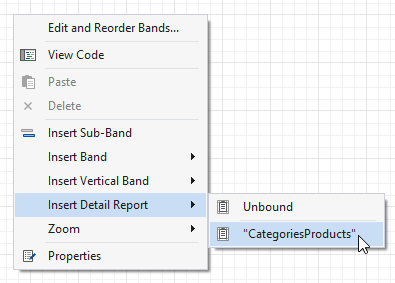
To create a detail report, right-click the report’s Detail band. In the invoked context menu, point to Insert Detail Report and click “CategoriesProducts”.
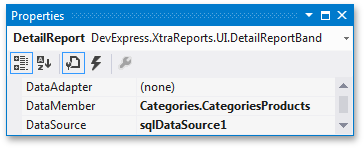
If the DetailReport is properly bound to the data, the following properties of the created DetailReport band should be set automatically.
- the XtraReportBase.DataMember property should be set to Categories.CategoriesProducts;
- the XtraReportBase.DataSource property should be set to sqlDataSource1.
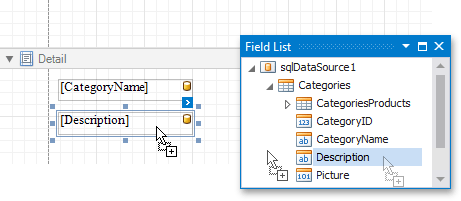
Drop the CategoryName and Description fields in the Field List window onto the Detail band.
Drop the ProductName and UnitPrice fields from the Field List’s CategoriesProducts section onto the DetailReport‘s Detail1 band.
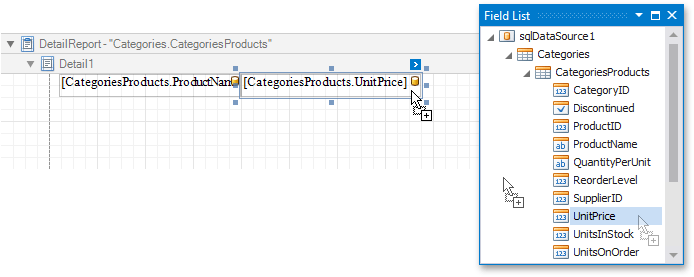
Note
Note that these fields must be taken from the CategoriesProducts relationship, and not from the Products table. Otherwise, the report will display only the first record of the Products table for each category, as many times as there are records in each category.
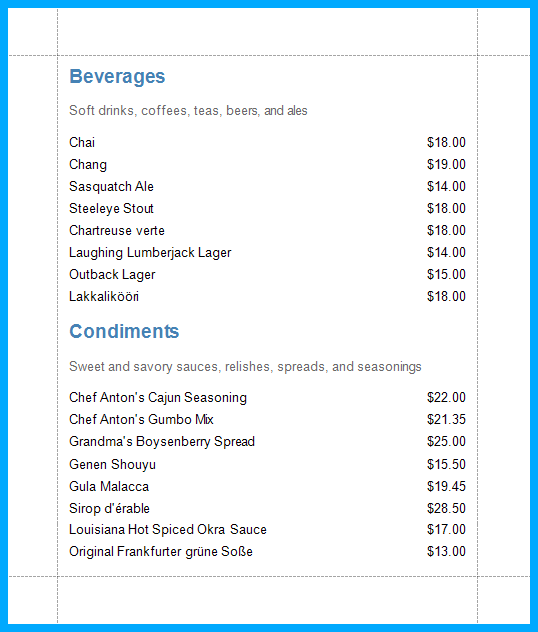
Your report is now ready to be generated. In Visual Studio, you can view the report by switching to the Preview tab.
Tip
To learn how to make the detail sections collapse or expand when clicking them in Print Preview, see Create Drill-Down Reports.