Create a Table Report
- 5 minutes to read
This tutorial describes how to create a table report on the Design Surface. This approach allows you to construct complex layouts and provides access to advanced table settings. As an alternative, you can use the Report Wizard to create basic template-based reports. Refer to the Create a Simple Data-Aware Report topic for more details on this approach.
Tip
The report created below is based on the Table Report Demo.
Add a new blank report to your application.
Bind to Data
Bind the report to the Northwind SQLite database that is supplied with the Demo installation:
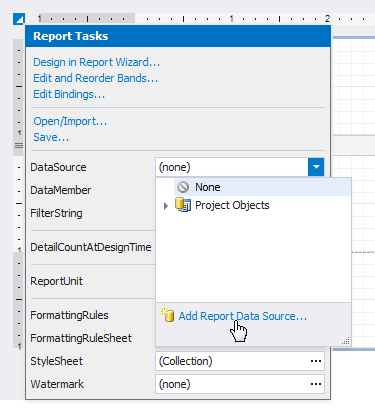
Click the report’s smart tag. Expand the DataSource drop-down list and click Add Report Data Source.
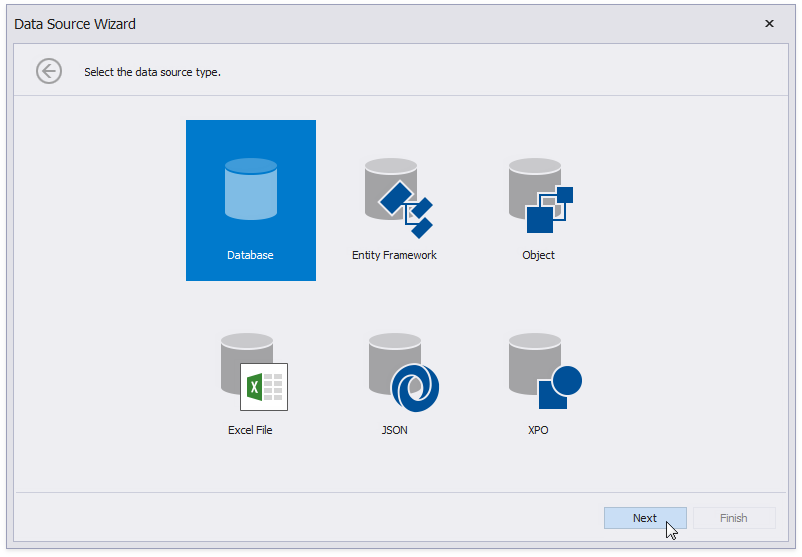
Select Database in the invoked Data Source Wizard and click Next.
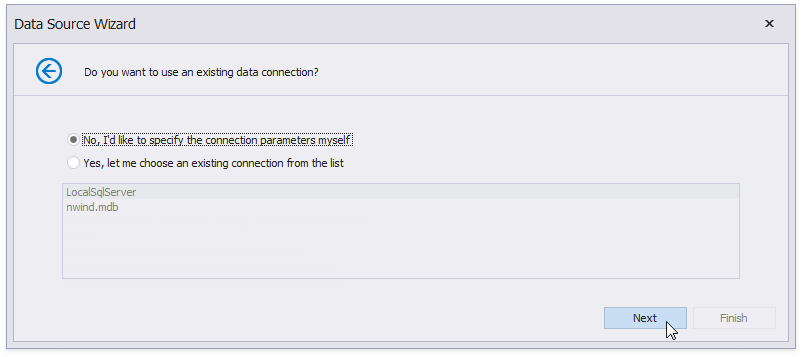
Select the No, I’d like to specify the connection parameters myself option and click Next.
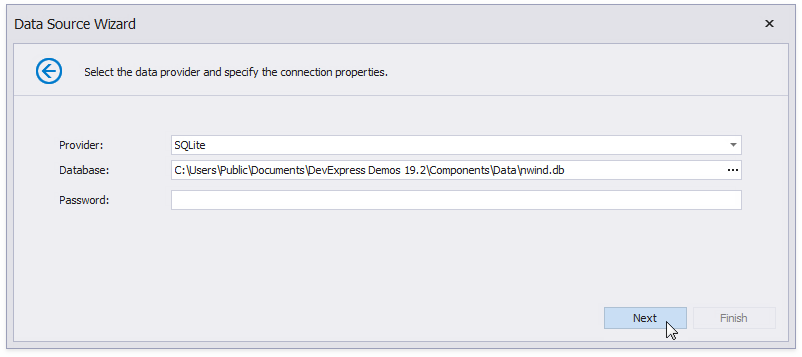
Select SQLite as the Provider and specify the path to the database file in the Database field. You can find the database file with your Demo installation at C:\Users\Public\Documents\DevExpress Demos 19.1\Components\Data\nwind.db. Click Next.
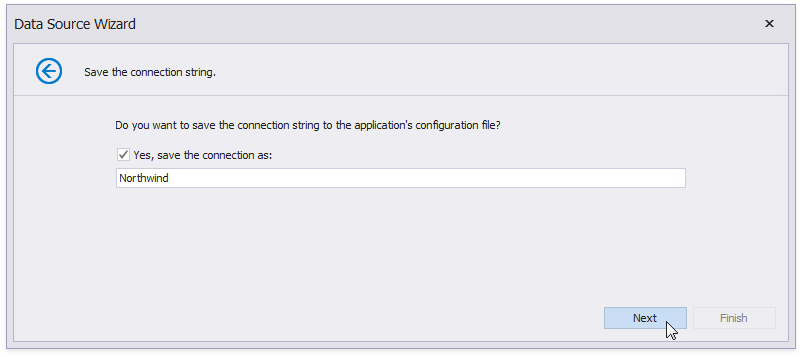
Save the connection string and click Next.
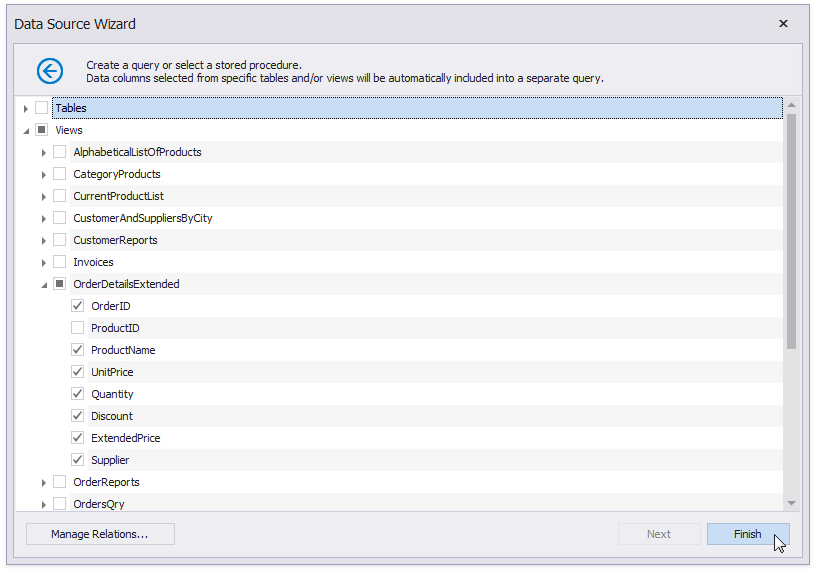
Expand the Views group and expand the OrderDetailsExtended view. Select the OrderID, ProductName, UnitPrice, Quantity, Discount, ExtendedPrice, and Supplier fields. Click Finish.
Create the Report Layout
Create the Products List
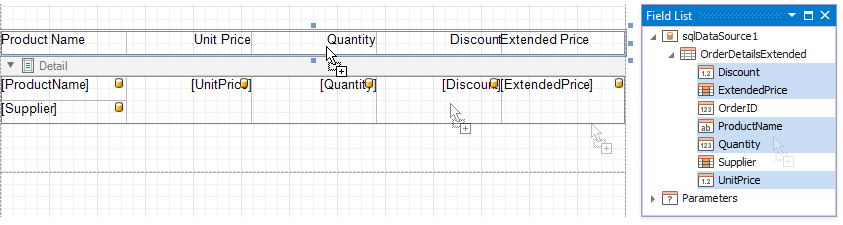
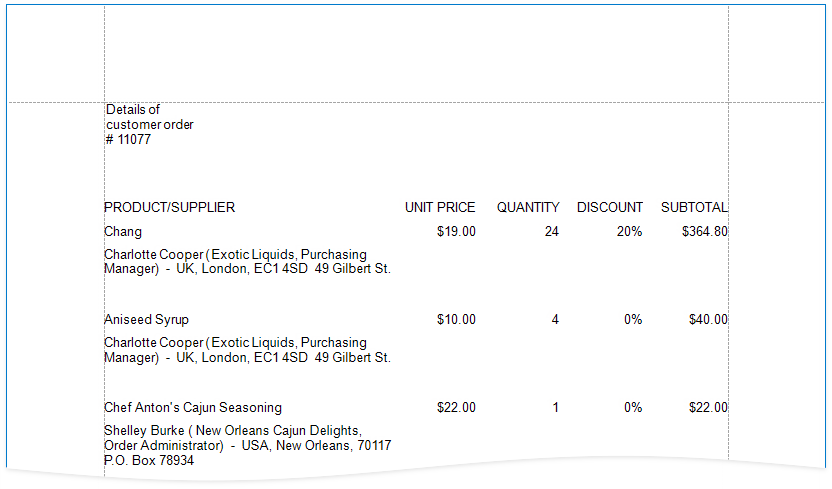
Expand the OrderDetailsExtended query in the Field List and select the ProductName, UnitPrice, Quantity, Discount, and ExtendedPrice fields. Hold CTRL or SHIFT and click on the fields to select multiple fields and drop them onto the Detail band.
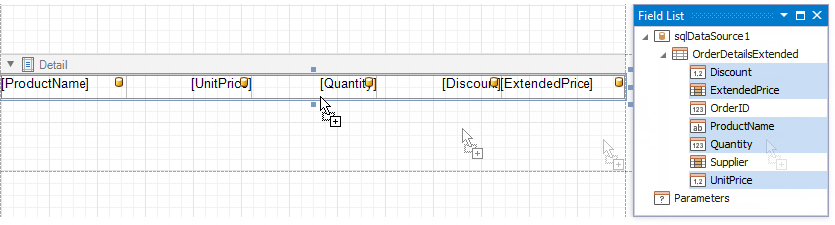
This creates an XRTable with each cell bound to a data field.
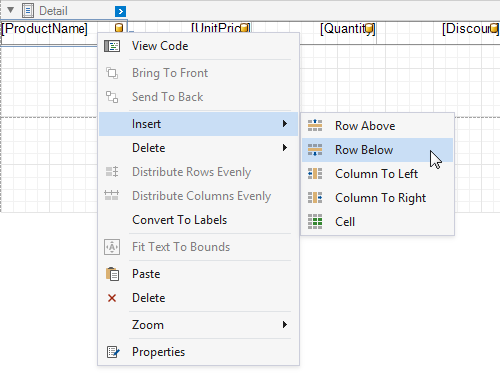
Right-click the table and select Insert / Row Below from the context menu.
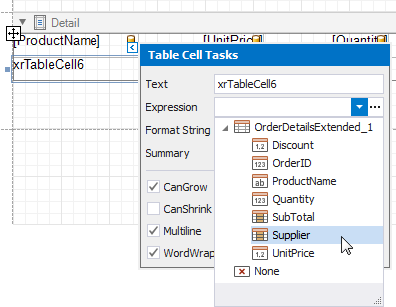
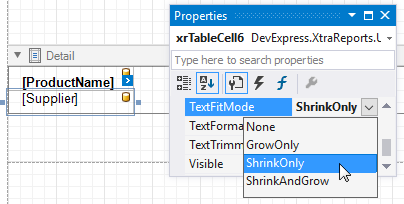
Click the xrTableCell6 cell’s smart tag and select the Supplier field in the Expression property.
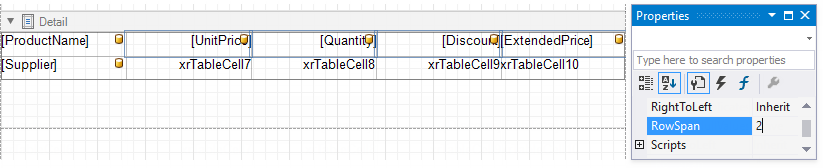
Make the currency and quantity cells span across two table rows. Select the UnitPrice, Quantity, Discount, and ExtendedPrice cells and set their RowSpan property value to 2.
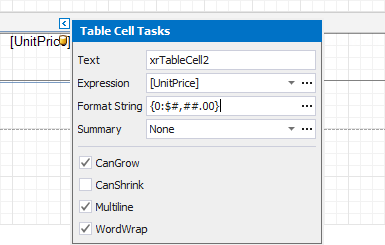
Format the currency and percentage data. Click the UnitPrice cell’s smart tag and set Format String to {0:$#,##.00}. Use the same approach to set the Discount cell’s format string to {0:0%} and the ExtendedPrice cell’s format string to {0:$#,##.00}.
Set the Supplier cell’s TextFitMode property to ShrinkOnly. This adjusts the cell’s font size to make variable-length text content occupy the entire cell.
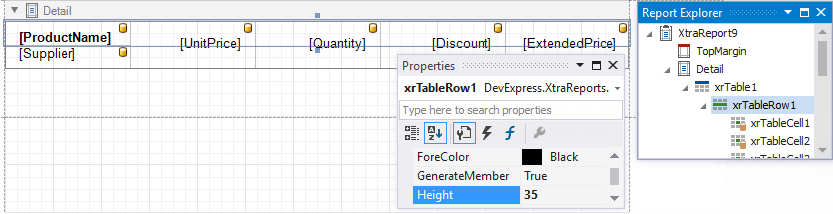
Align row heights. Switch to the Report Explorer window, select xrTable1 table’s xrTableRow1, and set its Height property to 35. Select xrTableRow2 and set its Height property to 55.
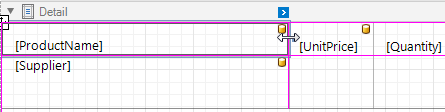
Select cells and drag their borders to adjust column widths.
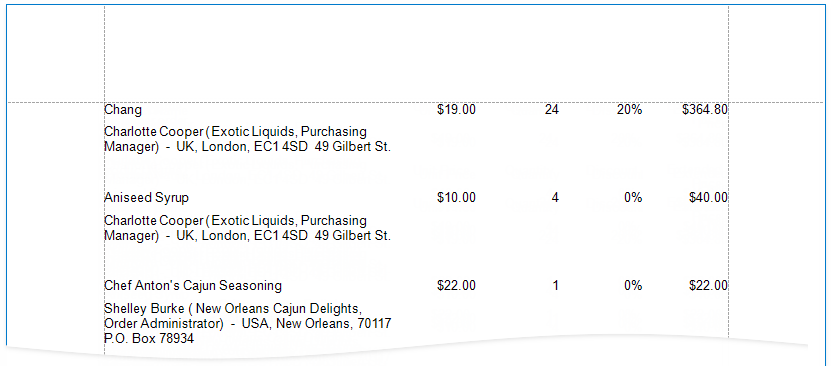
Switch to Print Preview mode to see the report’s draft version.
Add Page Headers
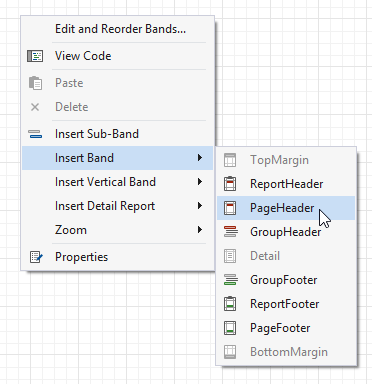
Add a Page Header band to the report to print column headers at the top of every document page. Right-click the report surface and select Insert Band / PageHeader from the context menu.
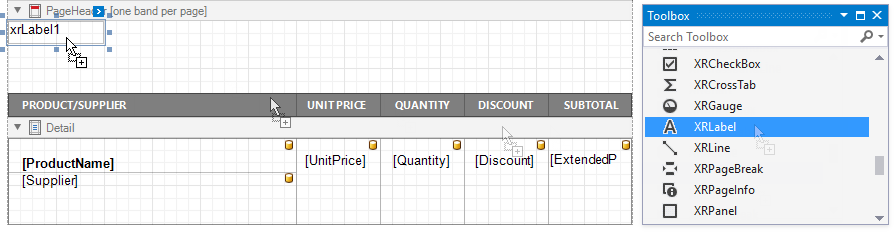
Switch to the Field List. Select fields for which you want to create column headers. Drag and drop the selected fields onto the PageHeader band with the right mouse button.
This creates a table where each cell shows a field name. If “camel case” is detected in a field’s name, it is converted to spelling that uses white spaces. Double click cells to change column names.
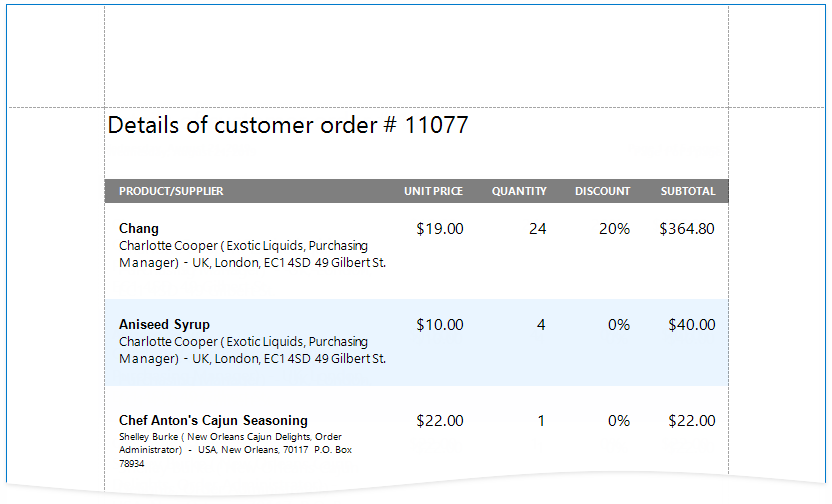
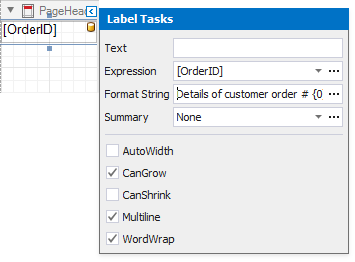
Add an XRLabel control to show the order number.
Click the label’s smart tag. Set the Expression property to [OrderID] and set the Format String property to Details of customer order # {0}.
Drag the label’s corners to adjust its size.
You can switch to Print Preview to see the progress.
Customize Appearance
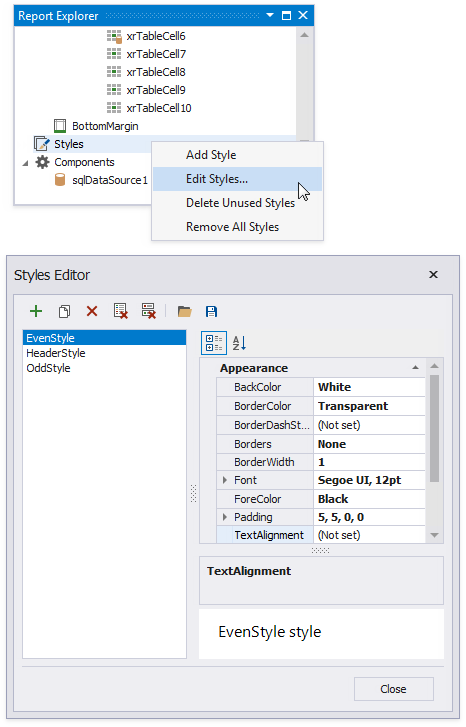
Create report styles to visually distinguish table headers and rows. Switch to the Report Explorer window, right-click the Styles item and select Edit Styles from the context menu. Add the following styles in the invoked Styles Editor:
Property
HeaderStyle
OddStyle
EvenStyle
BackColor
127,127,127
234,245,255
White
BorderColor
Gray
Transparent
Transparent
Borders
None
None
None
BorderWidth
1
1
1
Font
Segoe UI, 8pt, style=Bold
Segoe UI, 12pt
Segoe UI, 12pt
ForeColor
White
Black
Black
Padding
0,5,0,0
5,5,0,0
5,5,0,0
Select xrTable1 and assign the created OddStyle style to the table’s OddStyle property. Assign the EvenStyle style to the table’s EvenStyle.
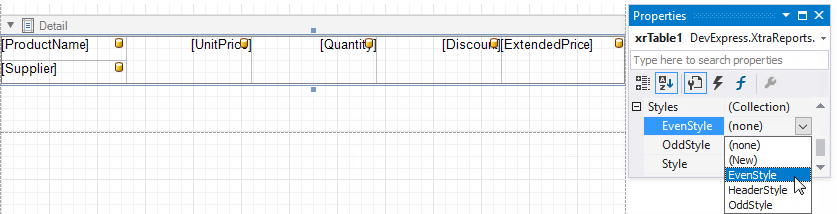
To select a table, click the handle which appears when you hover the mouse cursor over the table. To select multiple tables, hold CTRL when you click table handles.

Select xrTable2 and assign the HeaderStyle style to the table’s Style property.
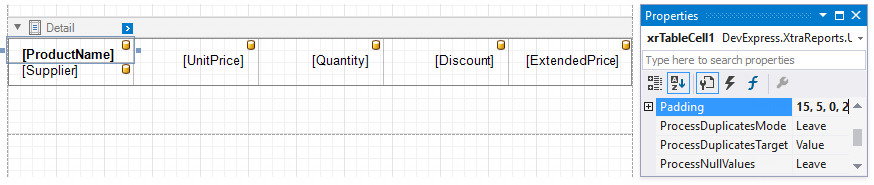
Set the following appearance options for xrTable1 cells:
Property
ProductName
Supplier
Other Cells
Bold
true
false
false
Padding
15,5,0,2
15,5,0,10
2,15,15,0
TextAlignment
BottomLeft
TopLeft
TopRight
Set the following appearance properties for header cells:
Property
ProductName
Other Cells
TextAlignment
MiddleLeft
MiddleRight
Padding
15,5,0,0
0,15,0,0
Set the xrlabel1 control’s Font to Segoe UI, 18pt to make the order number more visible.
Your report is now ready to be generated. In Visual Studio, switch to the Preview tab to view the report.