Add a Chart (Use a Series Template)
- 3 minutes to read
This document describes how to add a XRChart control based on a common series template.
Create a Reporting Application
Open an existing reporting application or create a new one from scratch to get started with this tutorial.
The report created in this tutorial is platform-agnostic. You can use it in any supported platform’s applications.
Add a Chart to the Report
Do the following to add a chart control to a report:
Drop the XRChart control from the DX.23.2: Report Controls Toolbox tab onto the Detail band.
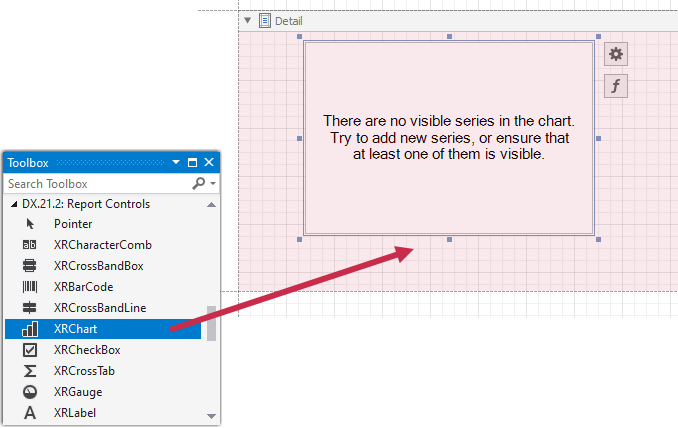
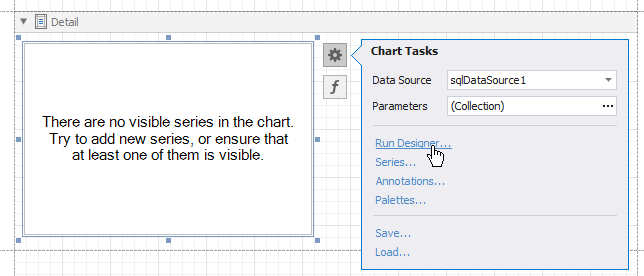
After you drop the chart, the Chart Designer is automatically invoked if its “Display the designer every time a new chart is added” option is enabled. Click Cancel to close the window.
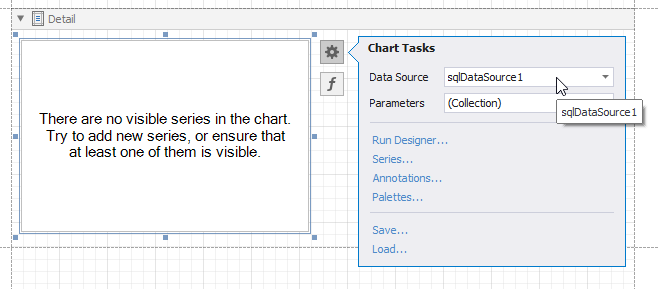
Click the chart’s smart tag to bind the chart to data. In the invoked actions list, expand the XRChart.DataSource property’s drop-down list and click Add Report Data Source.
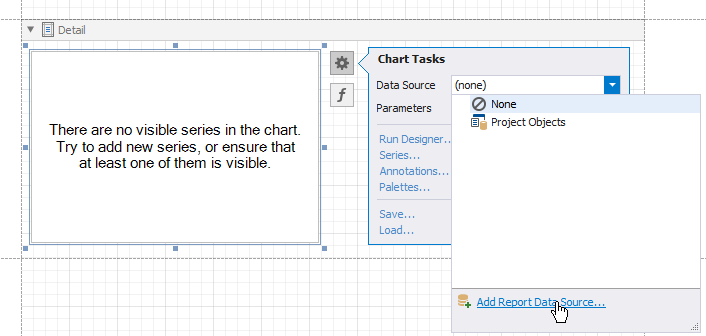
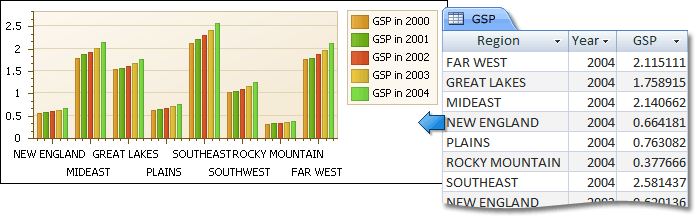
The invoked Data Source Wizard allows you to assign a data source to the chart. Bind the chart to the GSP database’s GSP table as described in the Bind a Report to a Database topic. The database ships with the DevExpress installation package (the default path is C:\Users\Public\Public Documents\DevExpress Demos 23.2\Components\Data\gsp.mdb)..
After the data source is created, it is assigned to the chart’s DataSource property.
Note
When a report has its XtraReportBase.DataSource property specified, the Detail band is repeated in the Preview as many times as there are records in the report data source. Set the DataSource property to None if you do not want to repeat the chart on each report page.
Adjust the Series Template
Do the following to specify series data and adjust the series template:
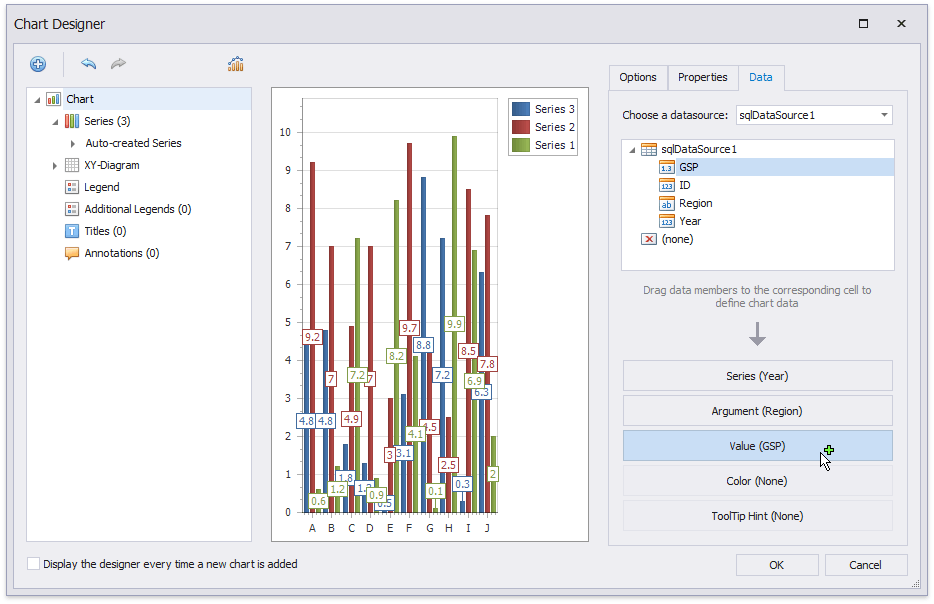
Click the chart’s smart tag and click Run Designer in the invoked actions list.
In the invoked Chart Designer, go to the Data tab to the right of the designer’s window. Select an existing data source in the corresponding drop-down list and drag-and-drop required data fields to the corresponding cells.
The Series cell specifies a data field that should provide data for series names. A new series should be created for each record in this data field. Use the Argument and Value cells to define where to get data for point arguments and values.
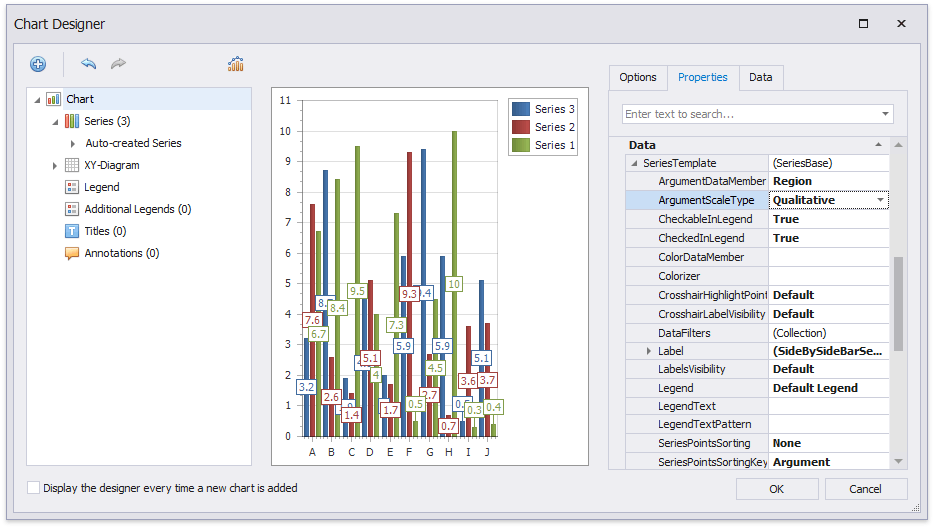
Switch to the Properties tab and expand the Series Template option. As you can see, the SeriesBase.ArgumentDataMember and SeriesBase.ValueDataMembers properties are automatically assigned to the corresponding data fields. Make sure that the SeriesBase.ArgumentScaleType and SeriesBase.ValueScaleType properties are set to appropriate values.
Customize the Chart
Perform the following customization to improve the chart’s appearance:
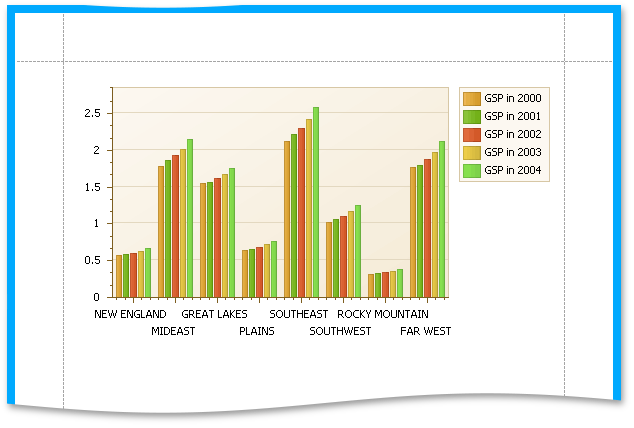
- The chart automatically generates each series’s name based on its XRChart.SeriesDataMember property value. You can use the ChartControl.SeriesNameTemplate property to add text to the beginning or end of each series name. For example, set the SeriesNameTemplate.BeginText property to “GSP in “.
- To avoid overlapping series labels, set the SeriesBase.LabelsVisibility property to False.
- Specify the color settings used to draw the chart’s series. For instance, in the drop-down Palette list, select Nature Colors.
Preview and Publish the Report
You can switch to the Preview tab in Visual Studio to preview your report.
See Print and Export Reports without a Preview to learn how to preview, print, and/or export reports in different platforms.