Create a Cross-Tab Report
- 4 minutes to read
This tutorial describes how to use the XRCrossTab control to create a report similar to the Sales Summary Report demo in Visual Studio at design time.
- View Online Demo.
- View Desktop Demo (requires the DevExpress Demo Center to be installed).
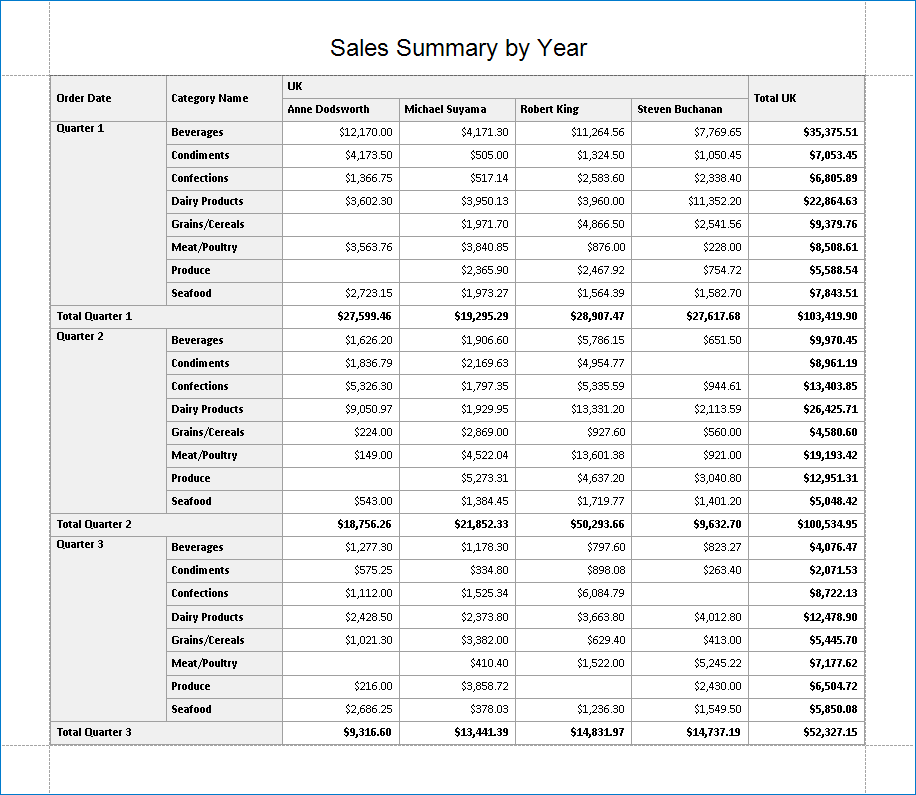
Cross-Tab Report - Page 1
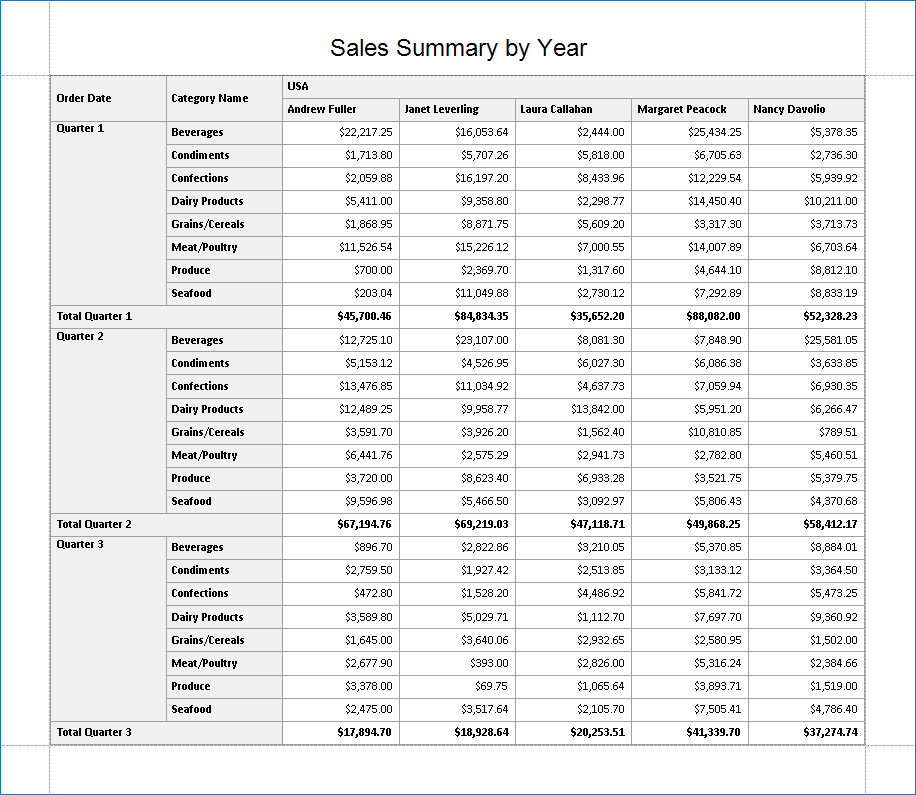
Cross-Tab Report - Page 2
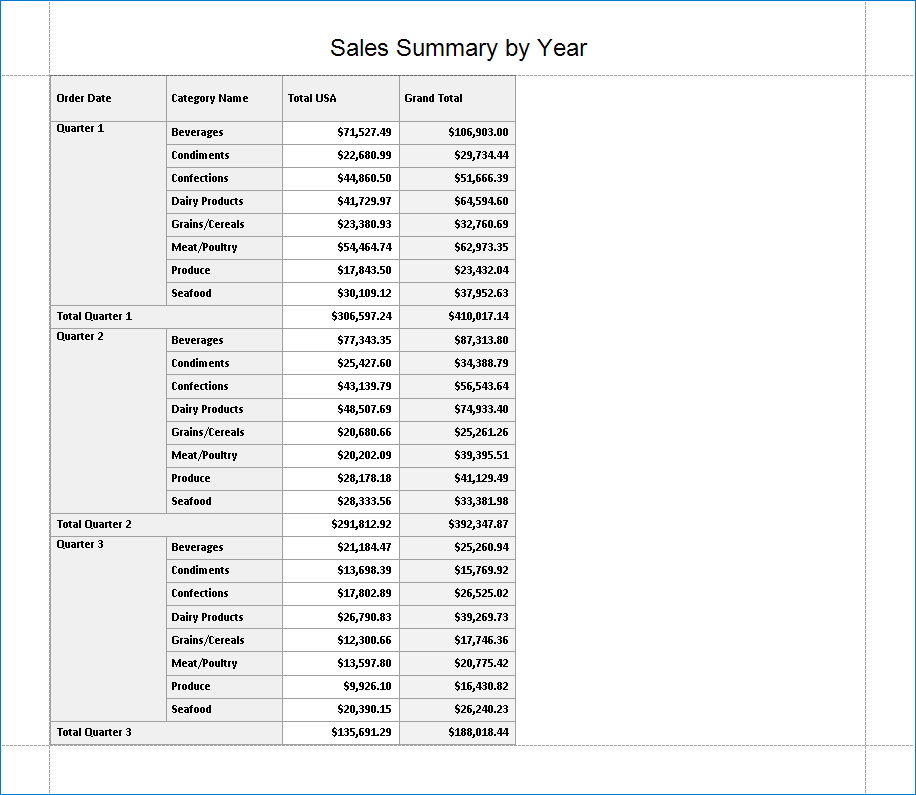
Cross-Tab Report - Page 3
Tip
This tutorial demonstrates how to use the Cross-Tab Report Wizard. See Create a Balance Sheet for information on how to configure the Cross Tab control on the Design Surface.
Add a Cross-Tab Report
Invoke the Report Wizard.
Select Cross-Tab Report and click Next.

(3.1-3.4) Bind a report to a sample Northwind database. You can use the nwind.mdb file from the XtraReports installation (the default path is C:\Users\Public\Public Documents\DevExpress Demos 19.2\Components\Data\nwind.mdb).
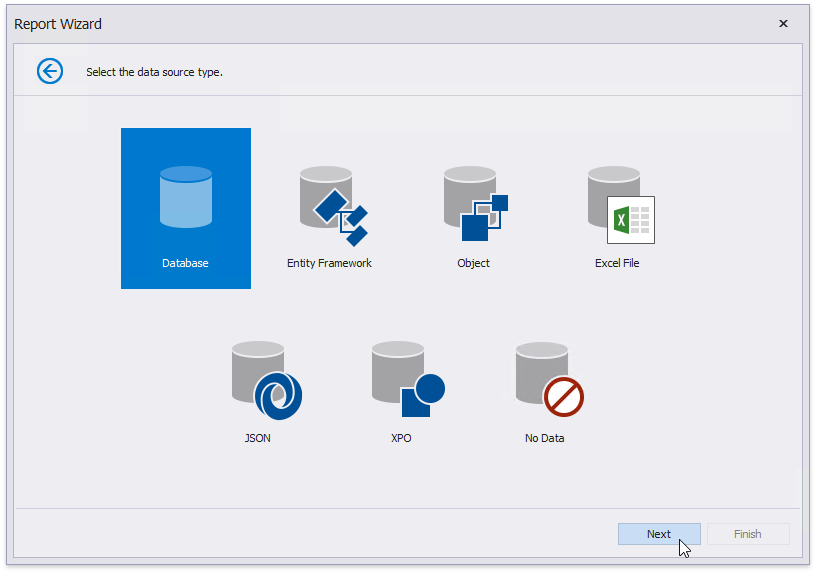
3.1. Select ‘Database’
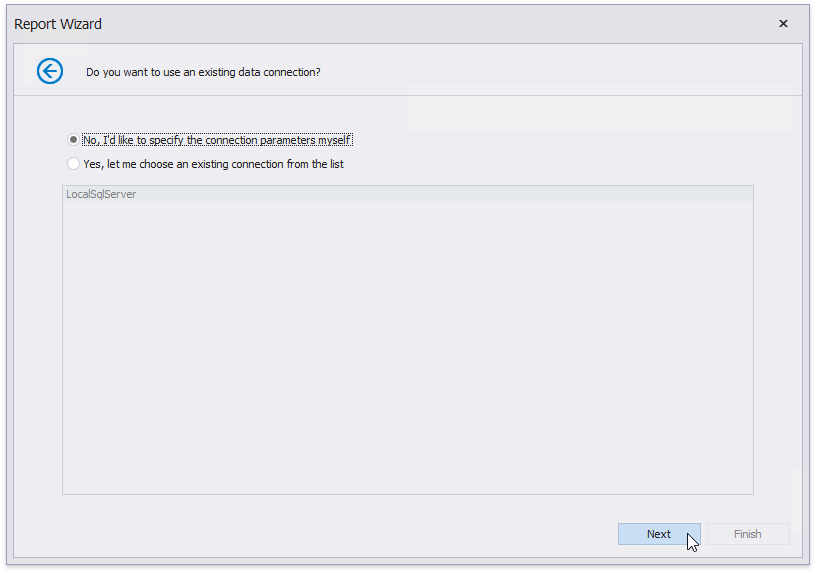
3.2. Select ‘No, I’d like to specify the connection parameters myself’
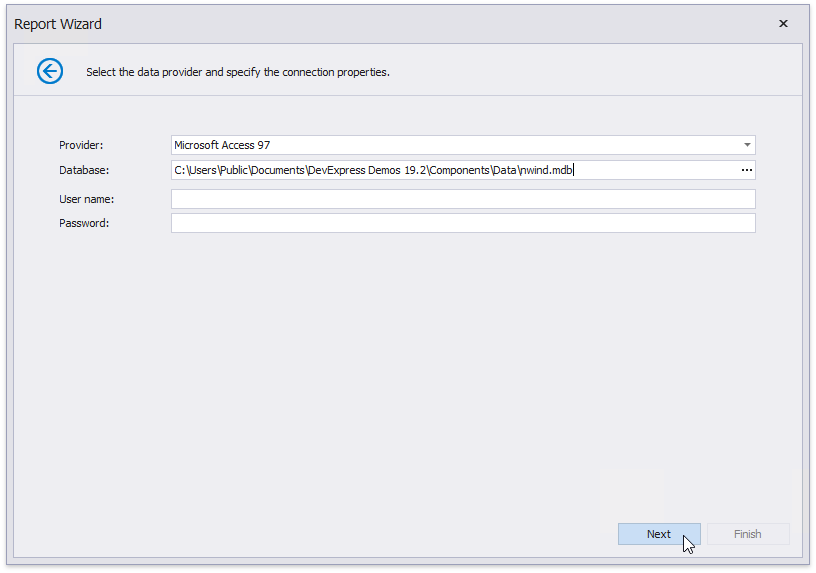
3.3. Specify connection string parameters
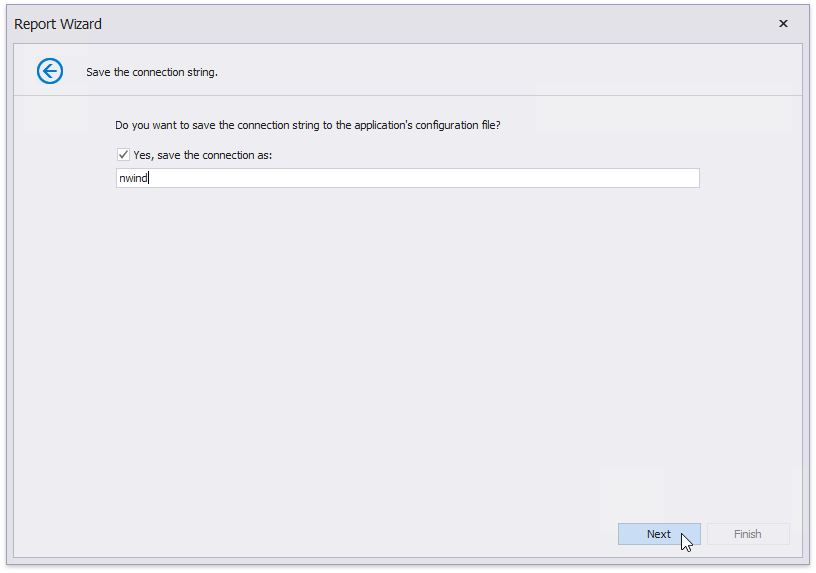
3.4. Save the connection string
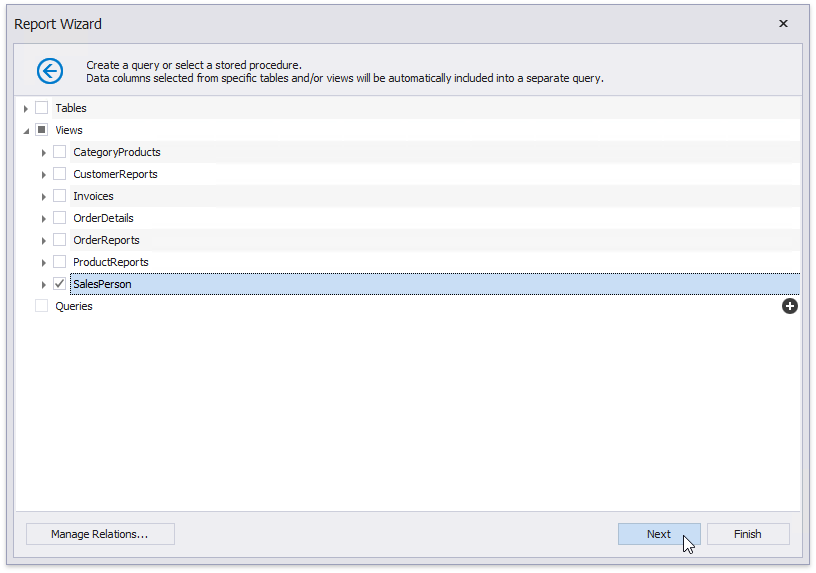
Select the SalesPerson view and click Next.
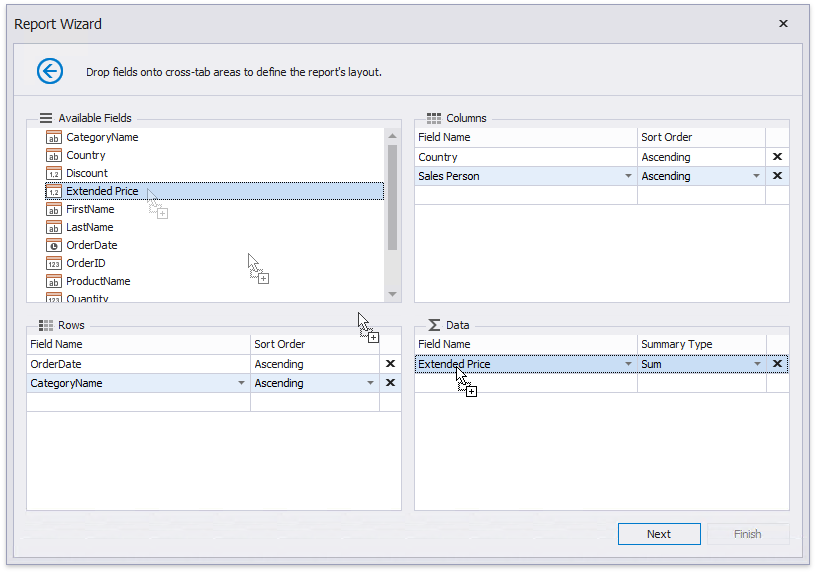
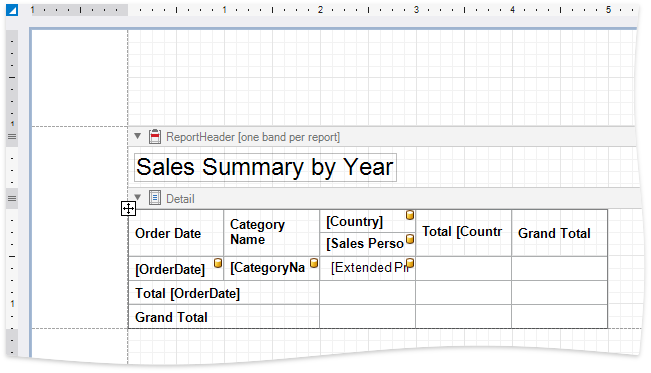
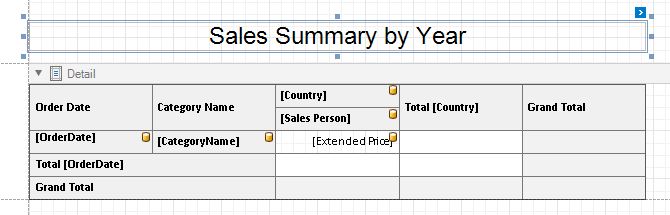
Drop data fields onto cross-tab areas:
- the OrderDate and CategoryName fields onto the Rows area;
- the Country and SalesPerson fields onto the Columns area;
- the ExtendedPrice field onto the Data area.
Note that the field order defines the hierarchy in the resulting cross-tab report. The higher the field on the list, the higher the level in the field hierarchy.
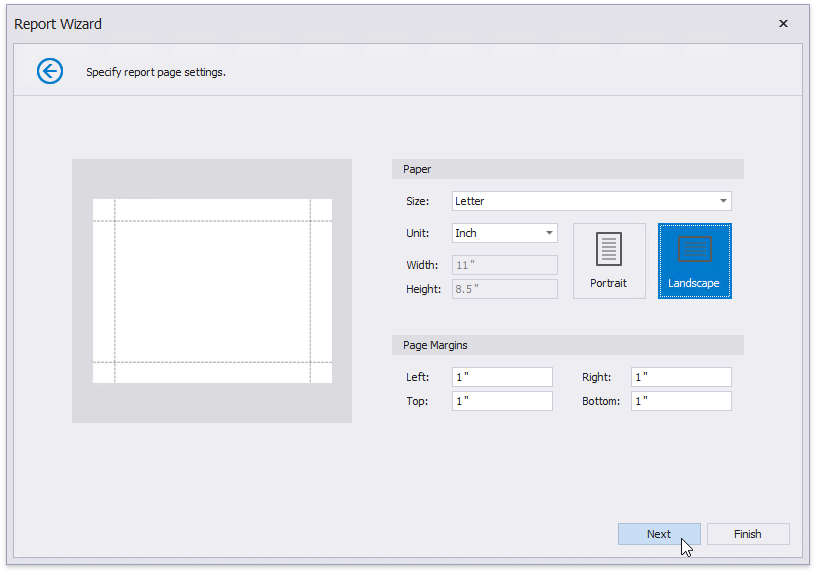
Change the report page layout to landscape to ensure the cross-tab content fits the report well. Click Next.
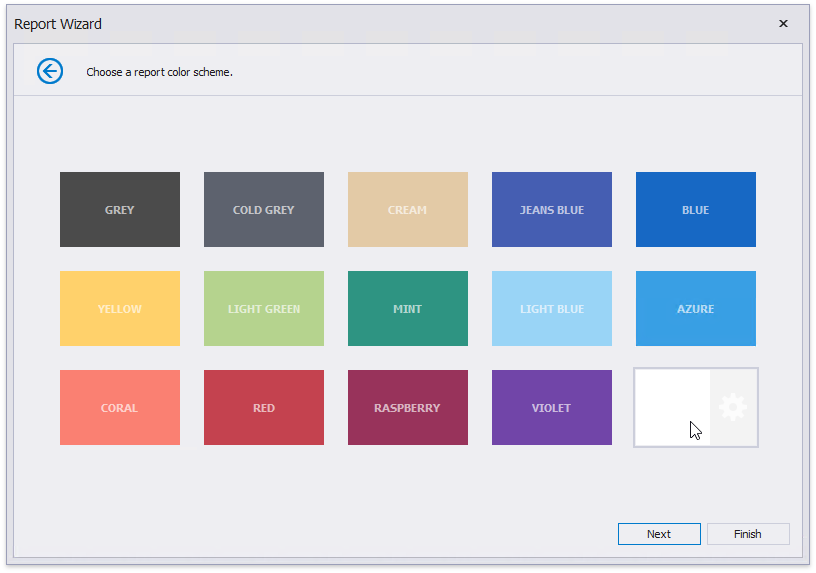
Set the report’s color scheme and click Next.
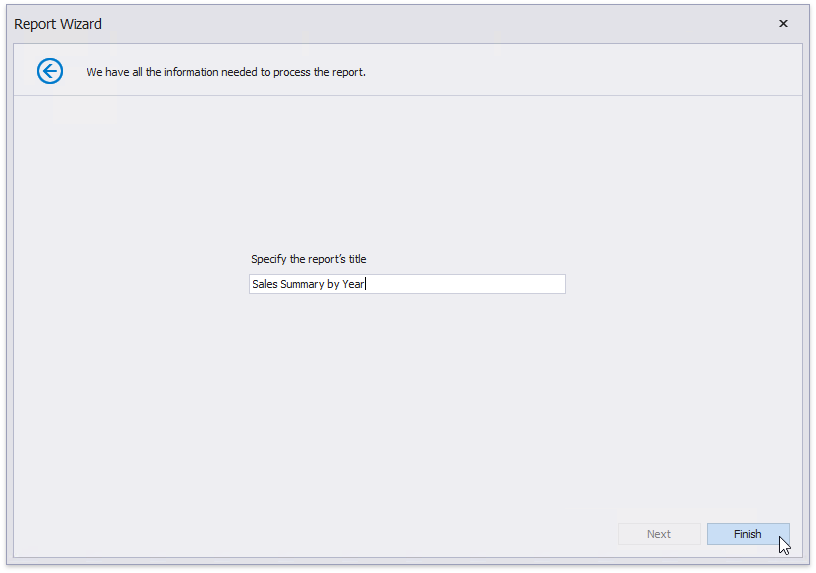
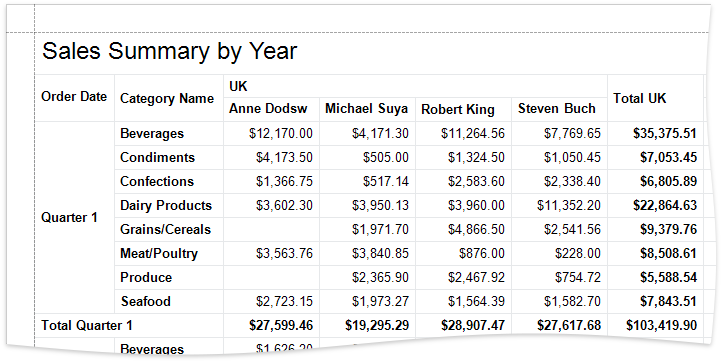
Specify the report’s title and click Finish.
The generated report contains the XRCrossTab control that is configured based on the specified settings. The XRCrossTab control calculates automatic totals and grand totals across row and column fields.
Tip
Ensure that a report’s DataSource property is not set because the Cross Tab control is located in the Detail band. Otherwise, the Cross Tab data is printed as many times as there are rows in the report data source.
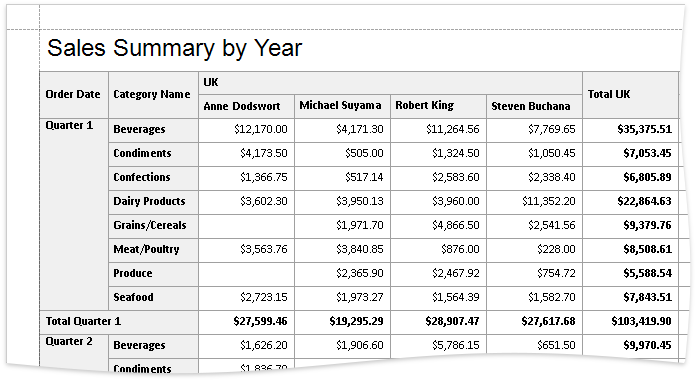
Switch to the Preview tab to see an intermediate result.
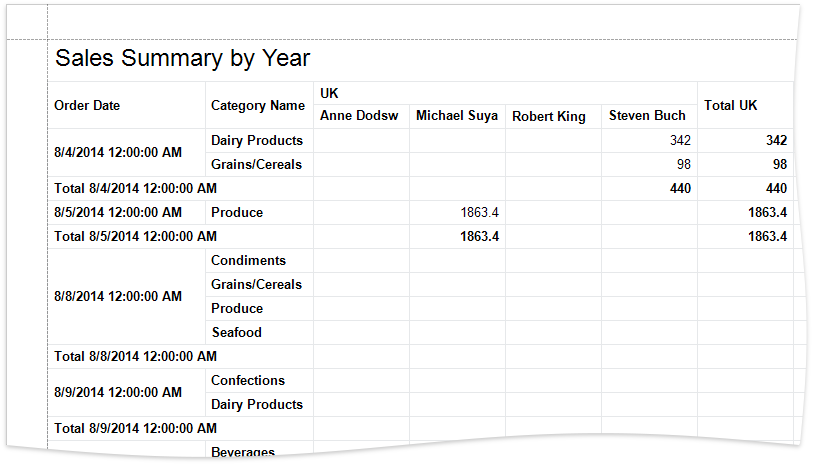
As you can see in the image above, the Cross Tab displays data for individual days.
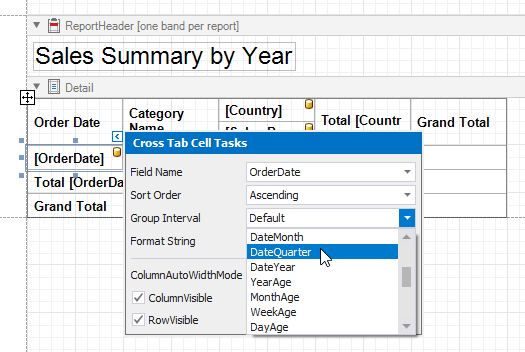
Specify Group Settings
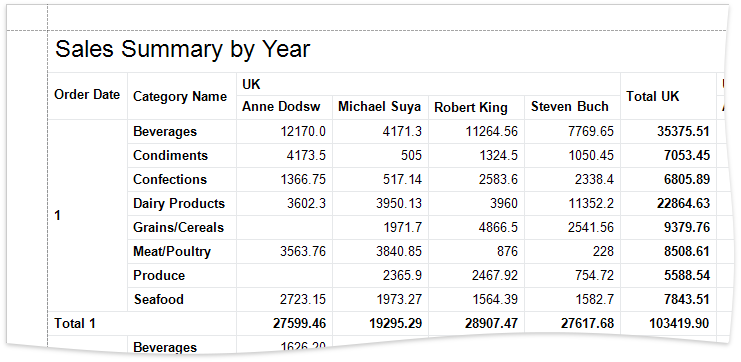
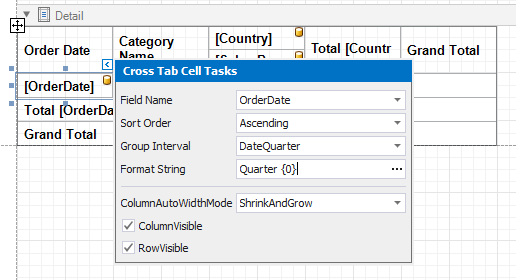
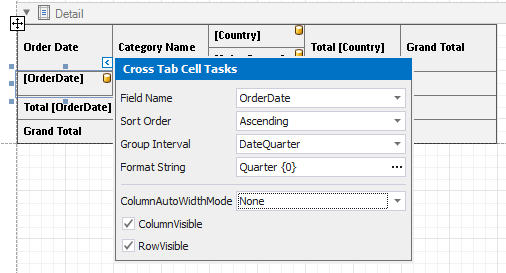
Select the Cross Tab cell bound to the OrderDate field and click its smart tag. Set the GroupInterval property to DateQuarter to group the original data by quarters.
Format Data
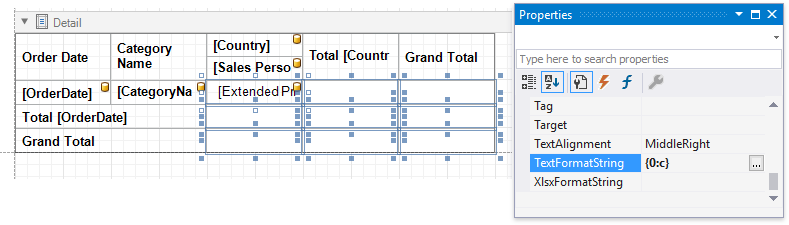
Format the currency data. Hold down SHIFT or CTRL, and select the following cells:
- the cell bound to the ExtendedPrice field;
- the cells that display column and row totals;
- the cells that display column and row grand totals.
Go to the Properties window and set the TextFormatString property to {0:c}.
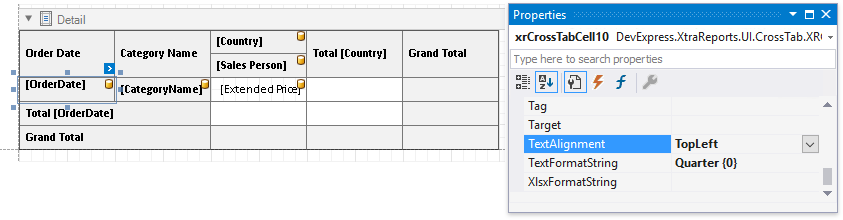
Select the cell bound to the OrderDate field and click its smart tag. Set the Format String option to Quarter {0}.
Customize Appearance
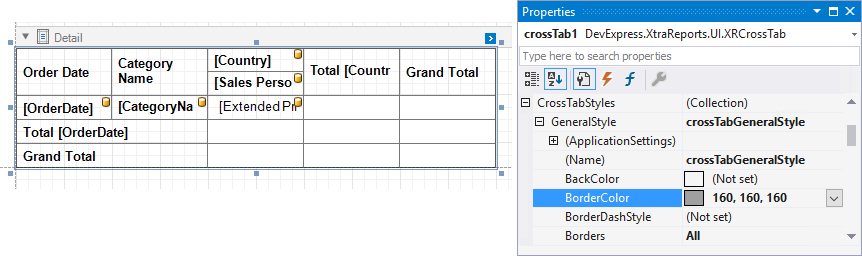
Select the Cross Tab, switch to the Properties window and expand the CrossTabStyles property. Expand the GeneralStyle property and set the BorderColor to 160, 160, 160. This value applies to all Cross Tab cells.
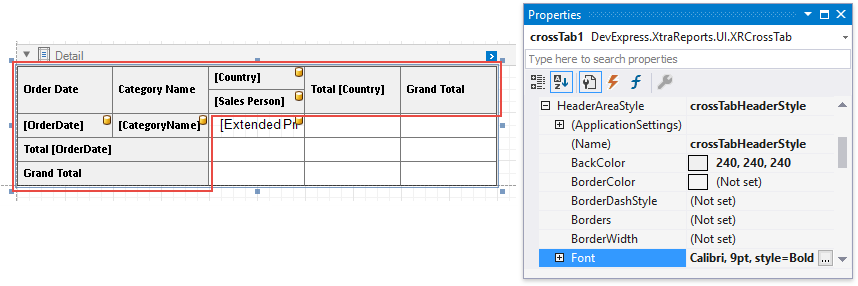
Expand the HeaderAreaStyle property and set the following properties:
- BackColor to 240, 240, 240
- Font to Calibri, 9pt, style=Bold
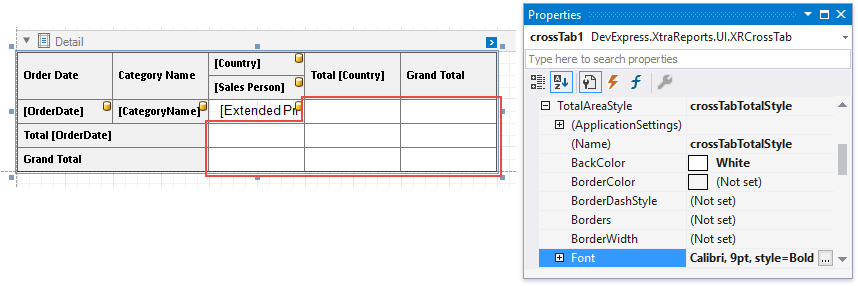
Expand the TotalAreaStyle property and set the Font to Calibri, 9pt, style=Bold.
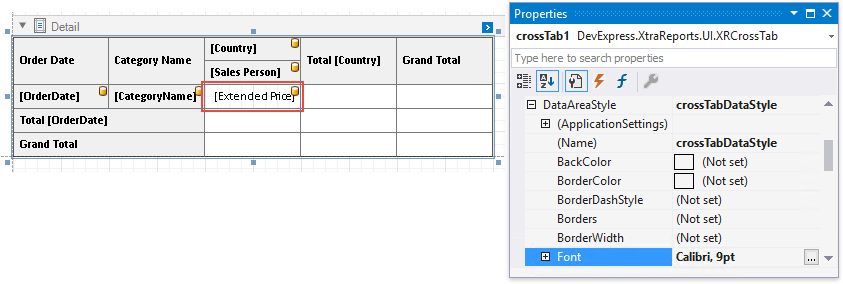
Expand the DataAreaStyle property and set the Font to Calibri, 9pt.
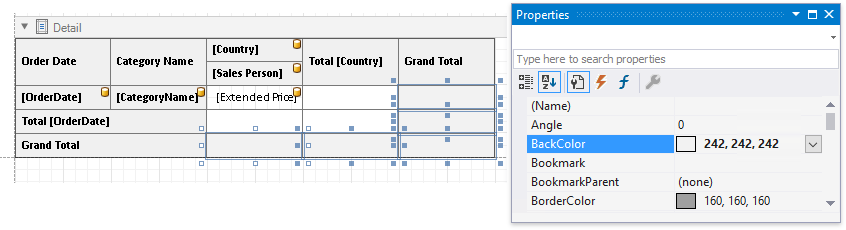
Hold down SHIFT or CTRL, and select the cells that display the grand total values. Go to the Properties window and set the BackColor to 160, 160, 160. This value applies to the selected cells only and overrides the value specified at the area level.
Select the cell bound to the OrderDate field and set the TextAlignment to TopLeft.
Adjust the Content Size
Use a cell’s ColumnAutoWidthMode property to specify whether and how to calculate the cell width. The Report Wizard sets this property to ShrinkAndGrow for row headers and to None for other cells.
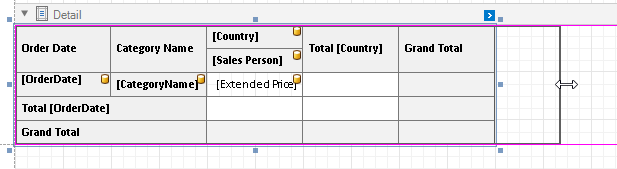
Drag the Cross Tab’s handlers to change its size. You can also adjust the size of individual rows and columns.
Move the report title to the Top Margin band to repeat the title on each page and make the Cross Tab occupy the entire page area.
Cross-Tab Report - Page 1
Cross-Tab Report - Page 2
Cross-Tab Report - Page 3