Create a Cross-Tab Report
- 4 minutes to read
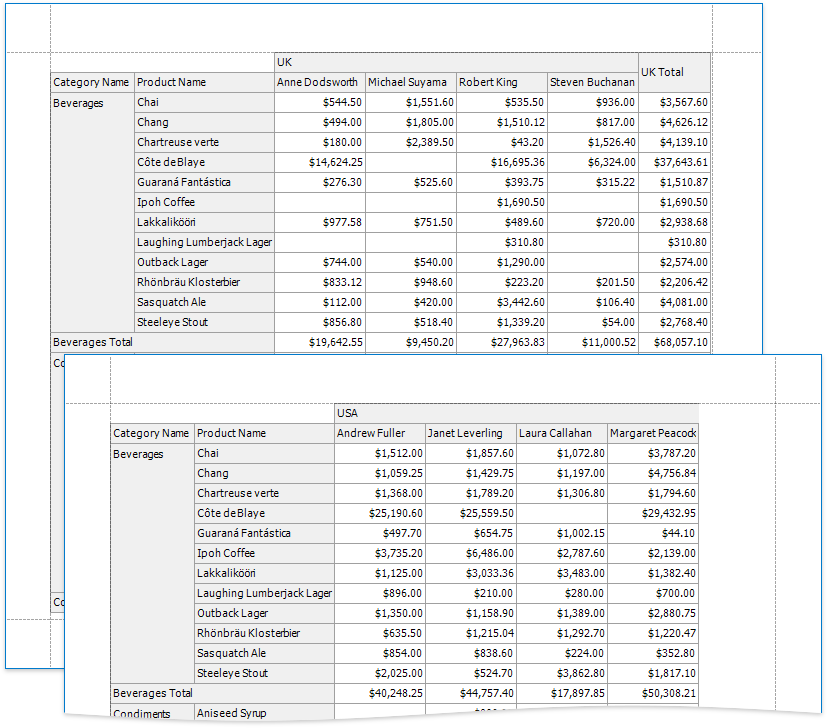
A cross-tab report displays complex multi-dimensional data, such as summary statistics, surveys, and market research information. This report uses a Pivot Grid control that calculates automatic summaries and grand totals across grouped rows and columns.
Tip
To get started with this tutorial, open an existing reporting application or create a new application (the Add a Report to Your .NET Application section explains how to create a reporting application on different platforms).
Perform the actions below to create a cross-tab report.
Add a Pivot Grid and Bind It to Data
Open the Report Designer and press CTRL+ALT+X to run the Toolbox. Expand the DX.19.1: Report Controls category and drop the XRPivotGrid control onto the report’s Detail band.
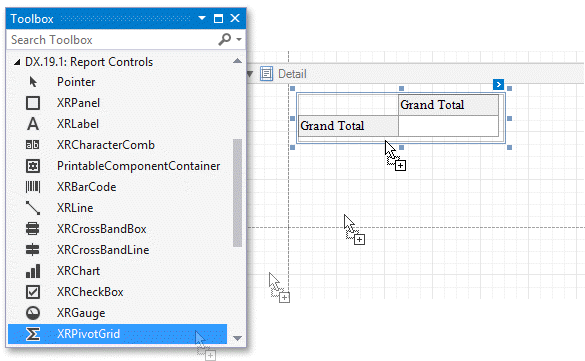
You cannot place a Pivot Grid in another report control (for example, XRTableCell or XRPanel) because its width cannot be determined at design time.
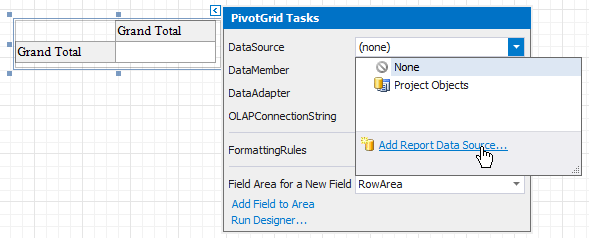
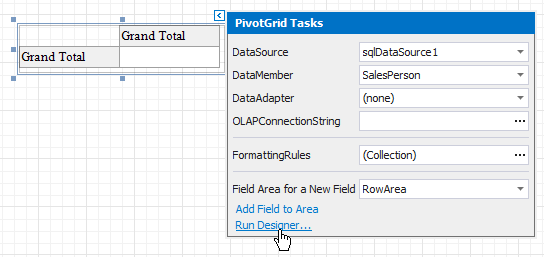
Click the created control’s smart tag, expand the XRPivotGrid.DataSource property’s drop-down list and click Add Report Data Source.
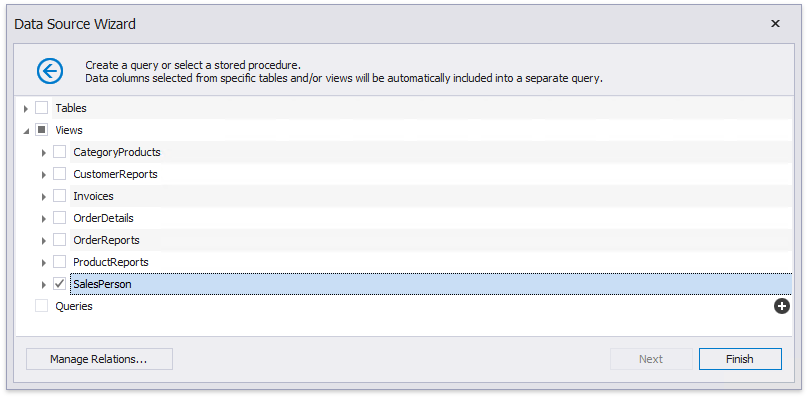
Follow the steps in the invoked Data Source Wizard to bind the Pivot Grid to data. In this tutorial, the Pivot Grid is bound to the sample Northwind database’s SalesPerson view (the nwind.mdb file included in the XtraReports installation).
Note
Ensure that a report’s XtraReportBase.DataSource property is not set if you place the Pivot Grid in the Detail band. Otherwise, the Pivot Grid data is printed as many times as there are rows in the report data source.
Define the Pivot Grid’s Content
Customize the Pivot Grid’s layout. To do this, click the control’s smart tag and select Run Designer in the invoked actions list.
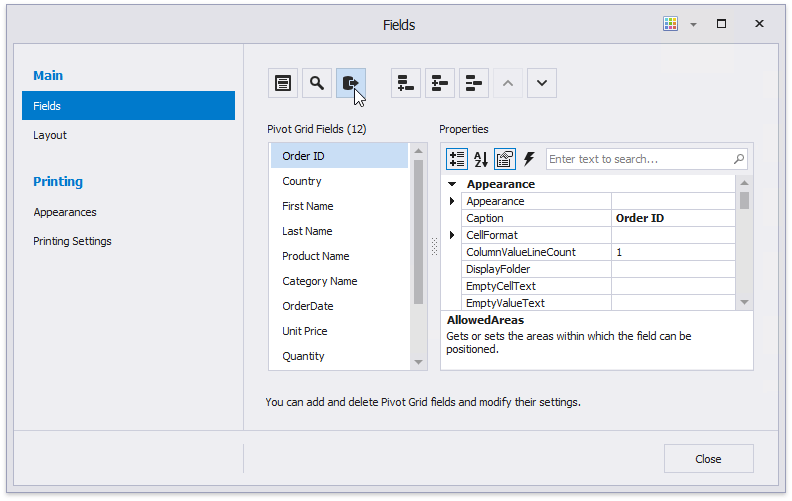
In the Pivot Grid Designer’s Fields page, click the Retrieve Fields button to obtain fields from the control’s data source.
Switch to the Layout page in the navigation bar on the left and drag-and-drop the required fields onto the appropriate areas to define the Pivot Grid’s layout. For example, you can drag-and-drop the following fields:
- the CategoryName and ProductName fields on the Row Fields area;
- the Country and SalesPerson fields on the Column Fields area;
- the ExtendedPrice field on the Data Items area.
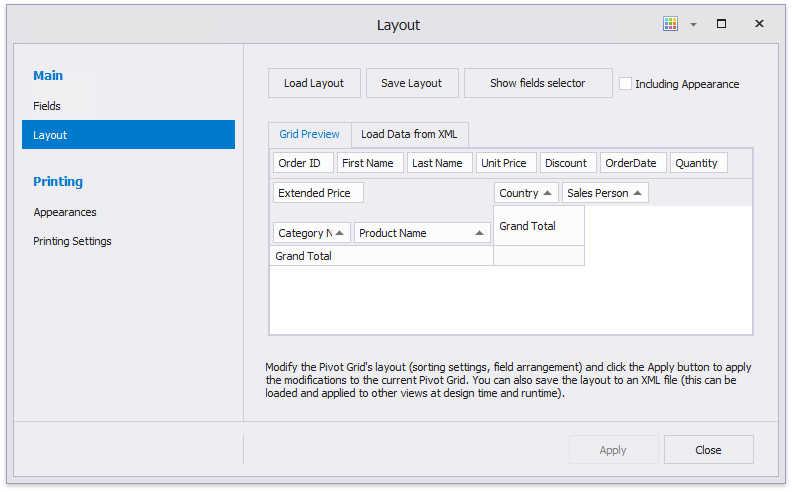
Click Apply to apply the changes and close the Designer.
Tip
To see how the pivot grid looks when it is populated with data, switch to the report’s Preview.
Return to the Report Designer and invoke the Pivot Grid Designer. The pivot grid fields are now populated with actual data and you can customize the grid.
Adjust the Pivot Grid’s Layout
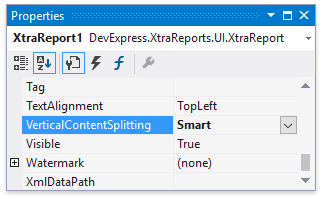
Set the report’s XtraReport.VerticalContentSplitting property to Smart to split the Pivot Grid along the column borders if it does not fit the report’s page in Print Preview.
You can adjust a column’s width to fit its content. To do this, handle the Pivot Grid’s XRControl.BeforePrint event and call the XRPivotGridField.BestFit method at runtime. You can also use the XRPivotGrid.BestFit method to resize all the columns that correspond to the data and row fields to display all their content.
using System.Drawing.Printing;
// ...

private void xrPivotGrid1_BeforePrint(object sender, PrintEventArgs e) {
    xrPivotGrid1.BestFit(fieldProductName1);
}
Specify the Pivot Grid’s Print Options
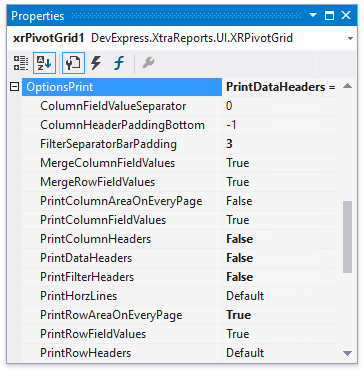
Use the XRPivotGrid.OptionsPrint property to specify print options and define which Pivot Grid elements are printed.
Disable the PivotGridOptionsPrint.PrintDataHeaders and PivotGridOptionsPrint.PrintFilterHeaders settings to prevent data fields and filter fields’ headers from being printed.
Enable the PivotGridOptionsPrint.PrintRowAreaOnEveryPage option to repeat row headers on each document page when the Pivot Grid’s layout is divided horizontally across several pages.
You can now preview the report. Switch to the Preview tab in Visual Studio.
The following topics describe how to show a report’s Print Preview on different platforms:
- Print Reports in WinForms Applications
- Print Reports in WPF Applications
- Print Reports in Web Applications
Tip
Refer to the WinForms Pivot Grid documentation for more information about the core Pivot Grid functionality.
See Link a Chart and a Pivot Grid for information on how to use a Pivot Grid as a Chart’s data source.
You can use XRPivotGrid in a report only. Use the following controls to create a Pivot Grid elsewhere in your application:
- WinForms: PivotGridControl
- ASP.NET: ASPxPivotGrid
- ASP.NET MVC: PivotGridExtension
- WPF: PivotGridControl