Create a Hierarchical Report
- 5 minutes to read
This tutorial describes how to use the detail band‘s HierarchyPrintOptions property to create a hierarchical report in Visual Studio at design time. Follow the steps below to create a report based on the Hierarchical Report demo that comes with the DevExpress Demo Center.
Tip
Online Example: How to Create a Hierarchical Report in Code
Add Demo Data
The Hierarchical Report demo creates and populates its data source in code. The example below demonstrates how you can define the DataSource class that supplies a list of data records to the report. Each record includes a “parent ID” field that defines the parent-child relationship and thus builds the hierarchy.
public class DataSource {
    public static List<SalesData> GetData() {
        List<SalesData> sales = new List<SalesData>();
        sales.Add(new SalesData(0, -1, "Western Europe", 30540, 33000, 32220, 35500, .70));
        sales.Add(new SalesData(1, 0, "Austria", 22000, 28000, 26120, 28500, .92));
        sales.Add(new SalesData(2, 0, "Belgium", 13000, 9640, 14500, 11200, .16));
        //...
        sales.Add(new SalesData(17, -1, "Eastern Europe", 22500, 24580, 21225, 22698, .62));
        sales.Add(new SalesData(18, 17, "Belarus", 7315, 18800, 8240, 17480, .34));
        sales.Add(new SalesData(19, 17, "Bulgaria", 6300, 2821, 5200, 4880, .8));
        //...
        return sales;
    }
}
public class SalesData {
    public SalesData(int id, int regionId, string region, decimal marchSales, decimal septemberSales, decimal marchSalesPrev, decimal septermberSalesPrev, double marketShare) {
        ID = id;
        RegionID = regionId;
        Region = region;
        MarchSales = marchSales;
        SeptemberSales = septemberSales;
        MarchSalesPrev = marchSalesPrev;
        SeptemberSalesPrev = septermberSalesPrev;
        MarketShare = marketShare;
    }
    // A node's ID in the hierarchical structure
    public int ID { get; set; }
    // A node's ParentID in the hierarchical structure
    public int RegionID { get; set; }
    public string Region { get; set; }
    public decimal MarchSales { get; set; }
    public decimal SeptemberSales { get; set; }
    public decimal MarchSalesPrev { get; set; }
    public decimal SeptemberSalesPrev { get; set; }
    public double MarketShare { get; set; }
}
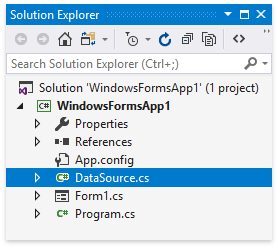
Copy the DataSource.cs/DataSource.vb file with this class from the C:\Users\Public\Documents\DevExpress Demos 19.1\Components\Reporting\CS\DevExpress.DemoReports\HierarchicalReport folder to your project to reproduce this tutorial.
Build your solution.
Add a Data-Bound Report
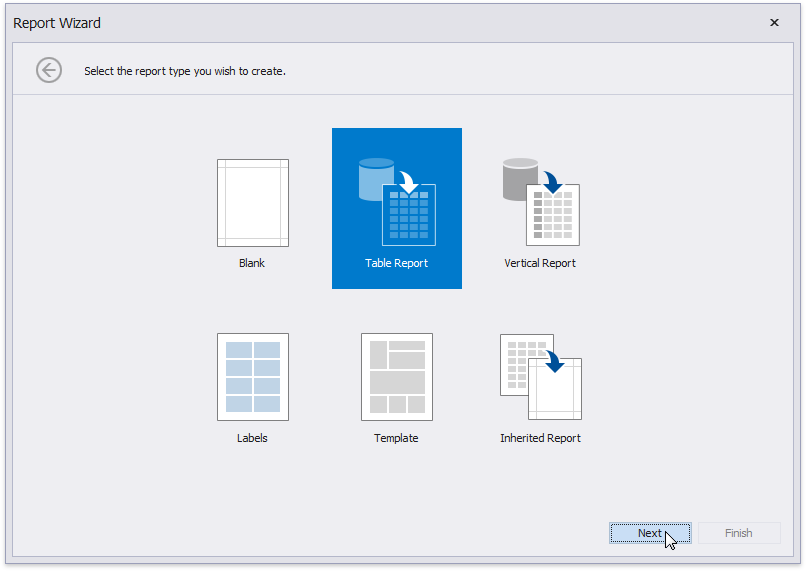
Invoke the Report Wizard.
Select Table Report and click Next.
(2.1-2.6) Create an ObjectDataSource based on the DataSource class that you added above.
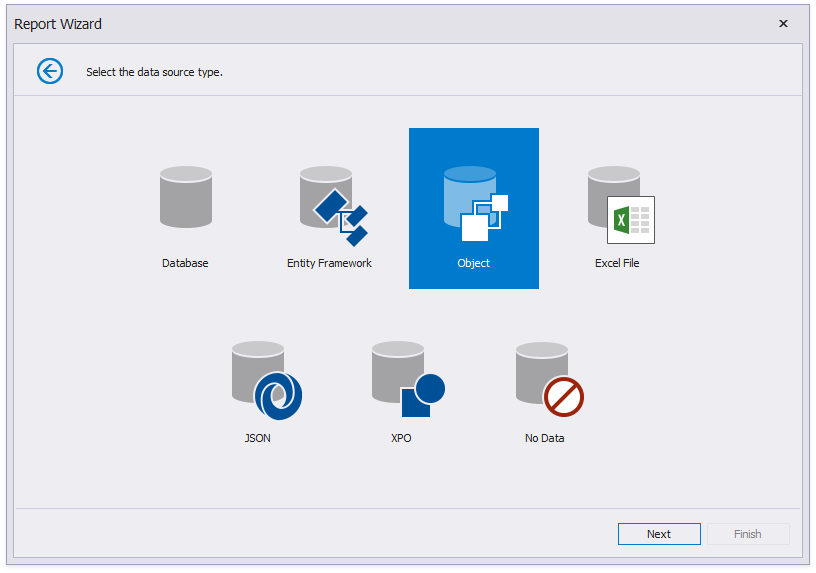
Select the data source type
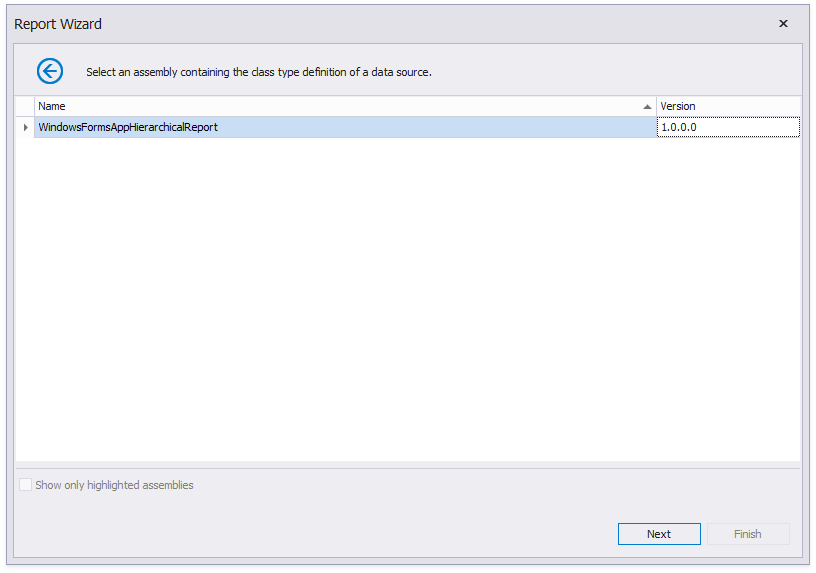
Select the assembly that contains the class type to bind
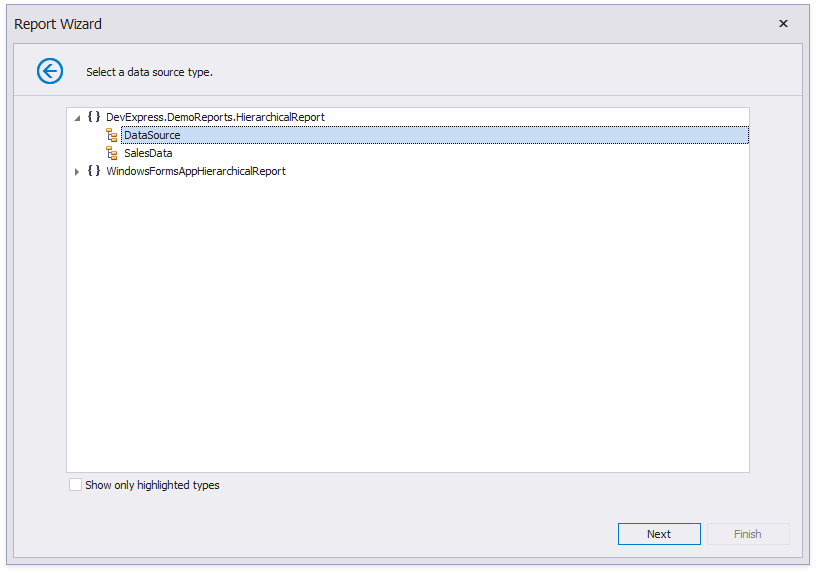
Select the class type to bind
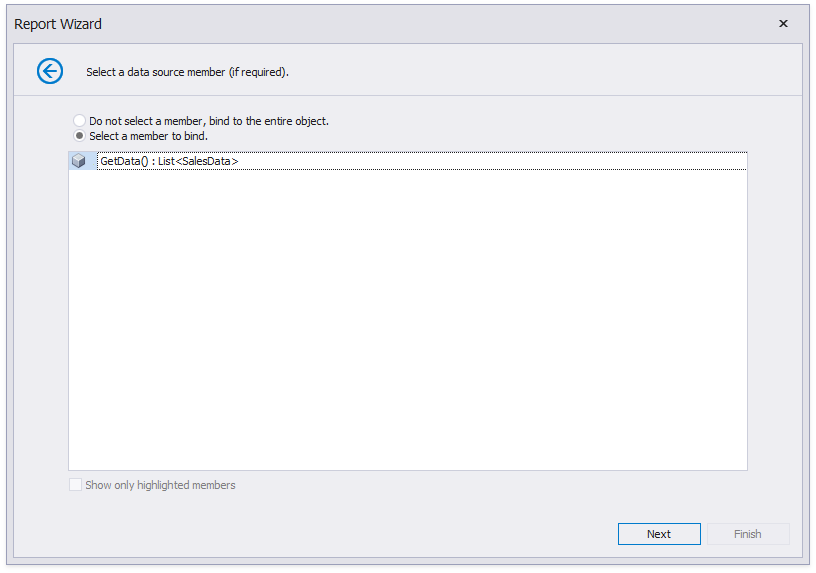
Select the class type’s member that provides data
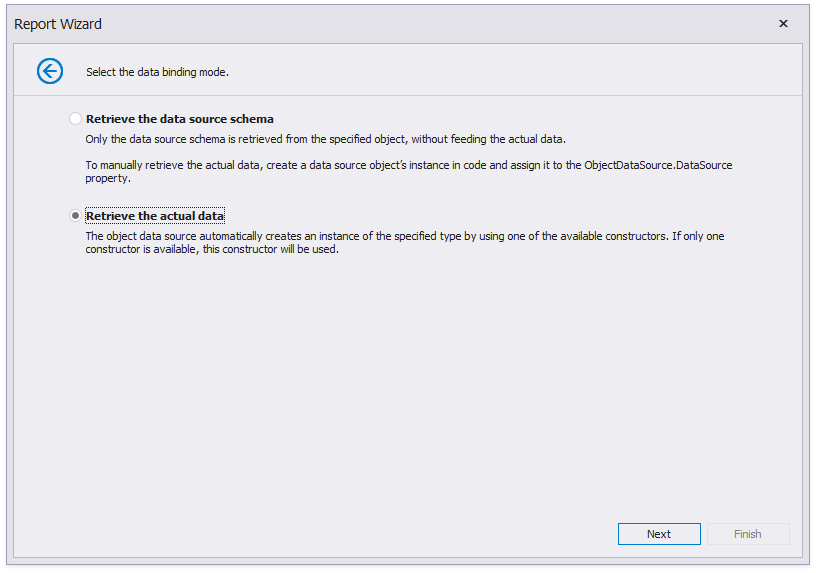
Select when to retrieve data
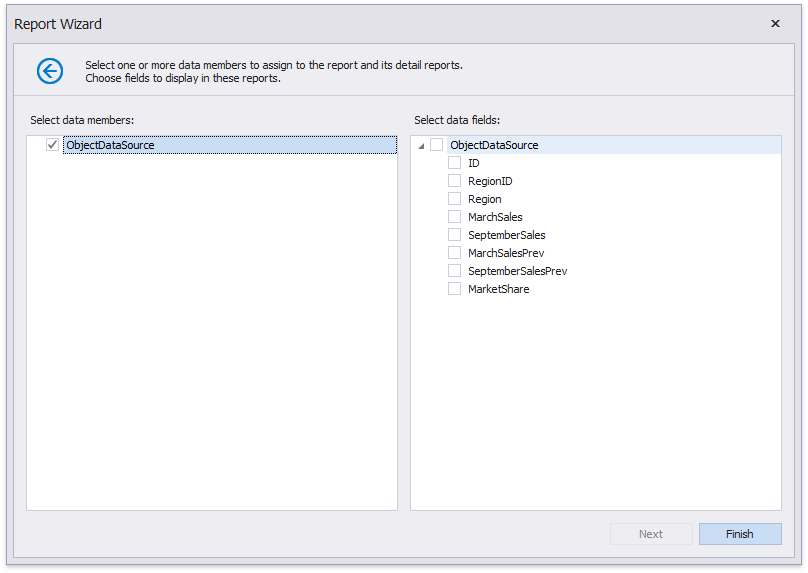
Leave data fields unselected to create an empty report bound to the created data source.
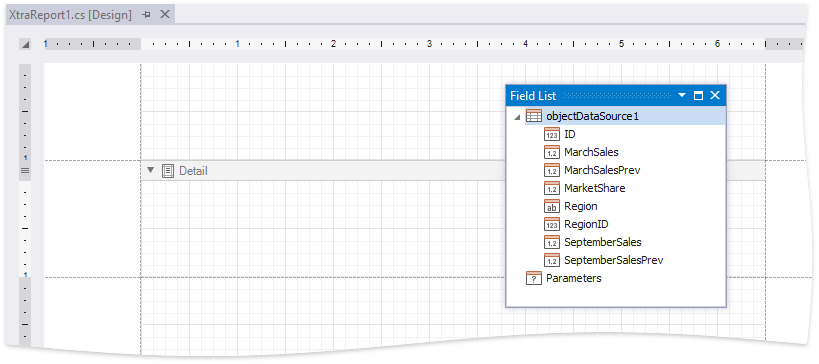
Click Finish and the Report Designer opens the generated report.
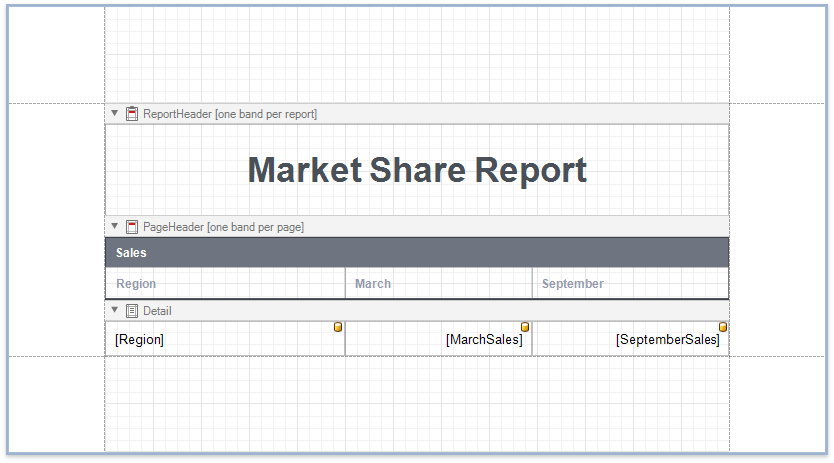
Arrange Controls on the Report
- Add the Report Header band.
- Add the Page Header band.
- Add data-bound labels to the Detail band.
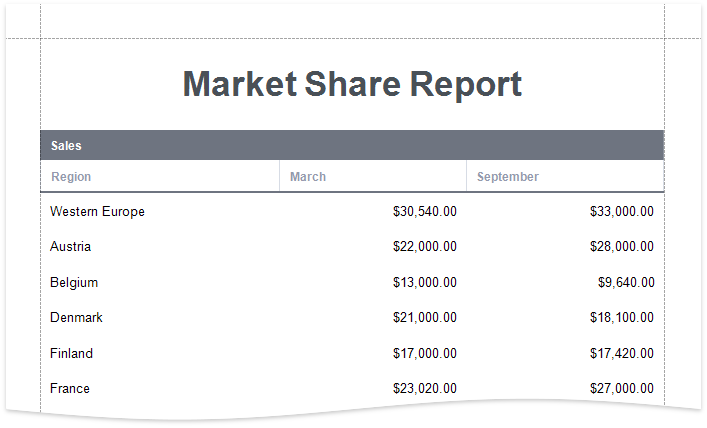
Switch to the Preview tab to see an intermediate result.
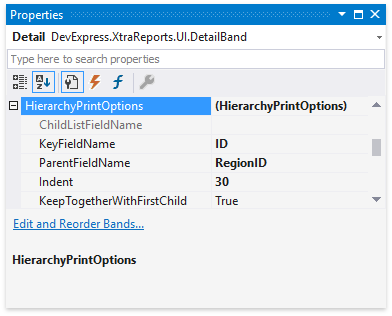
Specify Hierarchy Print Options
Do the following to print the report’s hierarchical data in tree mode:
Specify the Detail band’s HierarchyPrintOptions property.
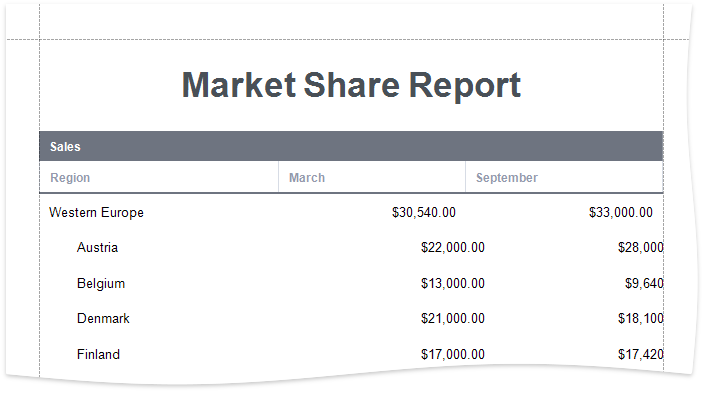
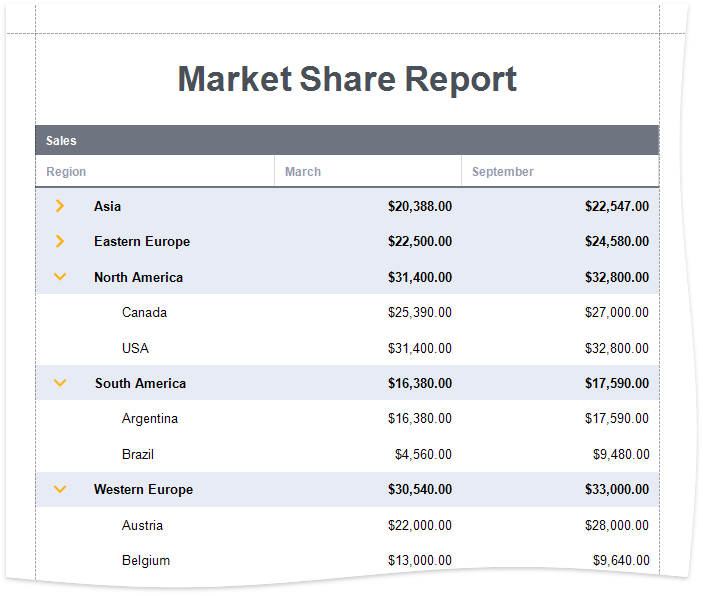
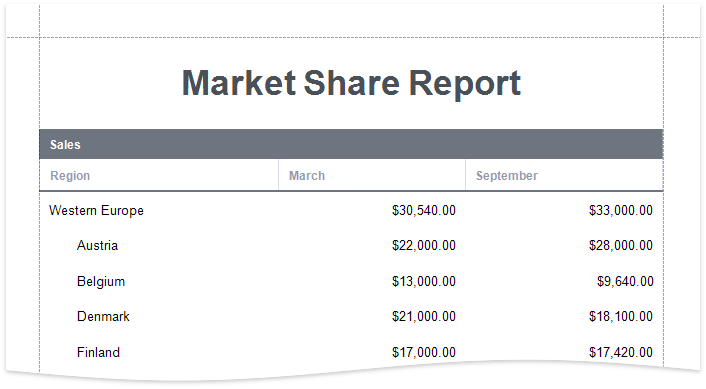
As you can see in the image above, the Detail band that contains child rows is printed with the specified indent. However, the row (the sum of the label widths) does not fit the page now.
Anchor the data-bound labels to the right edge of the Detail band (their container).
Set the label’s AnchorHorizontal property to Right.
Anchor the first data-bound label to the Detail band’s left and right edges.
Set the Region label’s AnchorHorizontal property to Both.
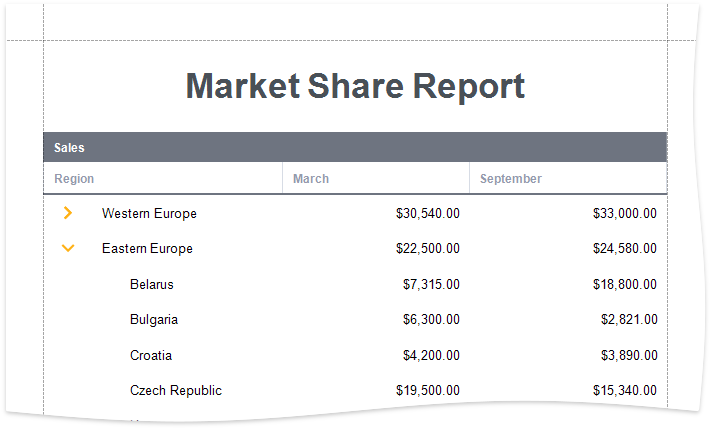
Add a Drill-Down Control
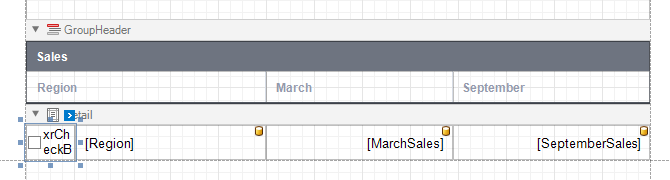
Add the XRCheckBox control to the Detail band at the left-most position.
Set the XRCheckBox control’s glyph options.
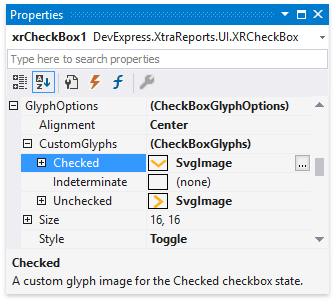
You can use your glyphs for the checked and unchecked checkbox states. In this tutorial, images from the DX Vector Images collection are used. This collection is available in the Image Picker that is invoked if you click the CustomGlyphs.Checked/CustomGlyphs.Unchecked property’s ellipsis button in the Properties window.
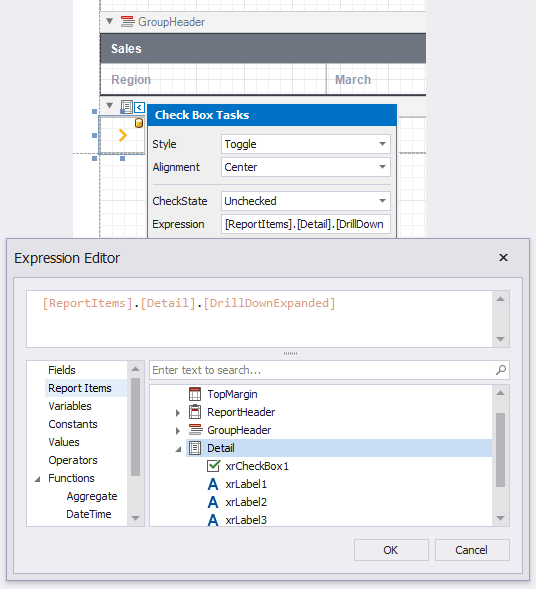
Set the Detail band’s DrillDownControl property to the added XRCheckBox control.
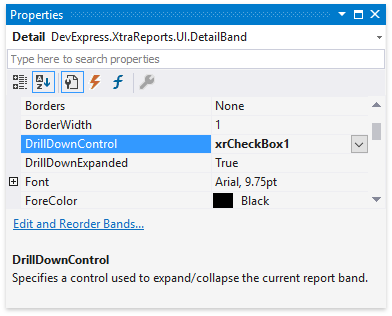
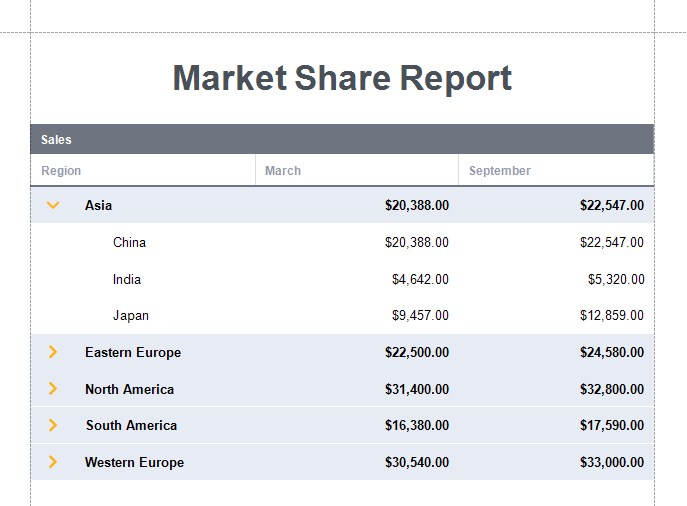
When a report is printed in tree mode, the Drill-Down control expands/collapses child rows.
Set the XRCheckBox‘s CheckState property to the following expression: [ReportItems].[Detail].[DrillDownExpanded] (in the control’s Smart Tag or the Property window’s Expressions tab).
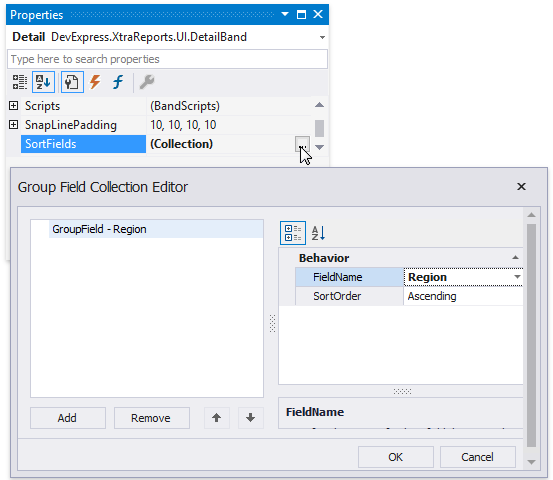
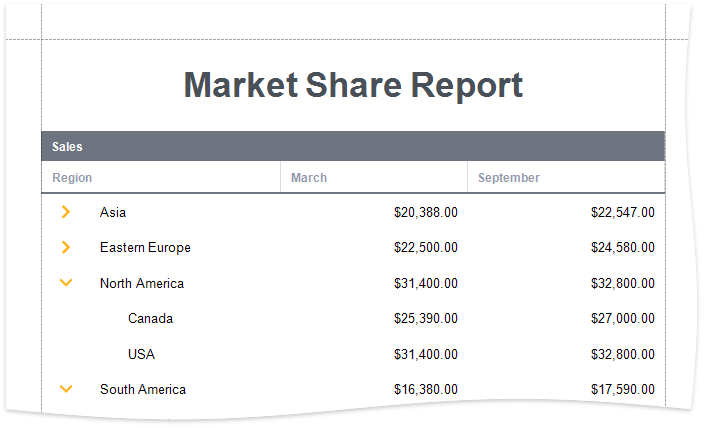
Sort Report Data
You can use the Detail band’s SortFields property to sort data on each hierarchy level.
Highlight Root Nodes
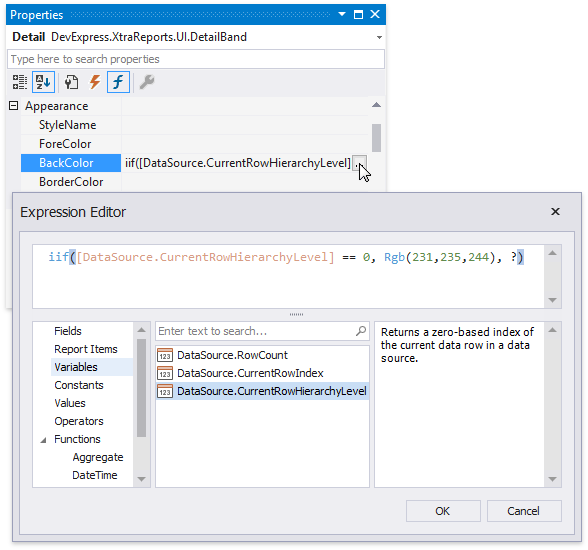
To format rows based on their nesting level, use the CurrentRowHierarchyLevel variable in expressions. For example, specify the Detail band’s appearance properties as listed below:
- Set the BackColor property to iif([DataSource.CurrentRowHierarchyLevel] == 0, Rgb(231,235,244), ?)
- Set the Font.Bold property to [DataSource.CurrentRowHierarchyLevel] == 0