Merge Reports: Use Data-Driven Page Sequence
- 3 minutes to read
This topic describes how to combine a table report that uses the Portrait page orientation and a chart report that uses the Landscape page orientation. A sample combined report is available in the Report Merging demo.
Follow the steps below to create a combined report:
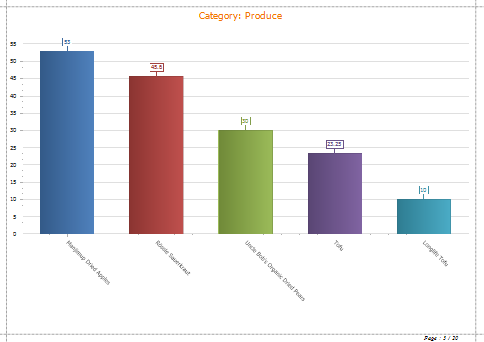
Create a Chart Report
Create a chart report that shows all products in a category. The report is bound to the sample Northwind database’s Products table (the nwind.mdb file is included in the XtraReports installation). Set the report’s Landscape property to true to enable the Landscape page orientation.
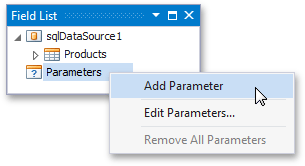
Add the CatID parameter to your chart report to specify which product category to build the chart for. Right-click Parameters in the Field List and choose Add Parameter.
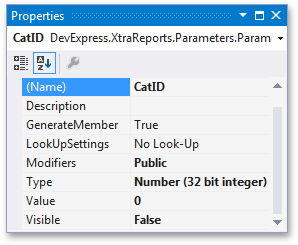
Select the created parameter and set its Parameter.Name property to CatID, Parameter.Type to Int32 and Parameter.Visible to false.
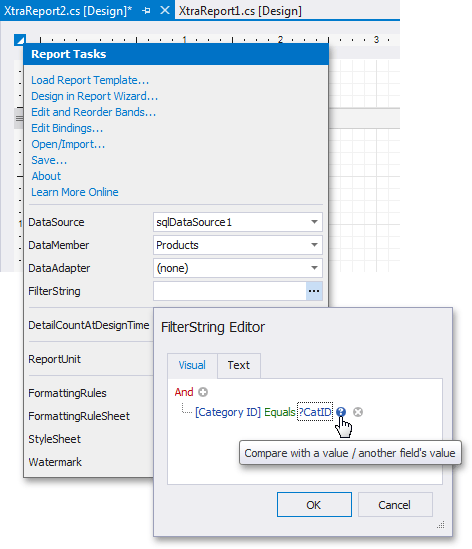
Click the report’s smart tag. Click the XtraReportBase.FilterString property’s ellipsis button. In the invoked FilterString Editor, construct an expression to compare the CategoryID data field to the CatID parameter. To access the parameter, click the icon on the right until it turns into a question mark.
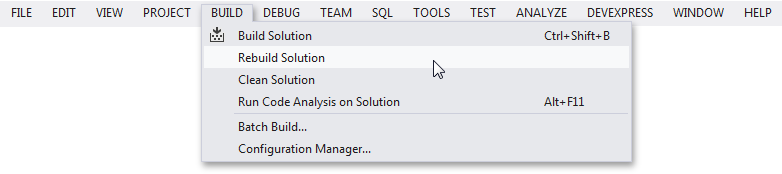
Rebuild your solution.
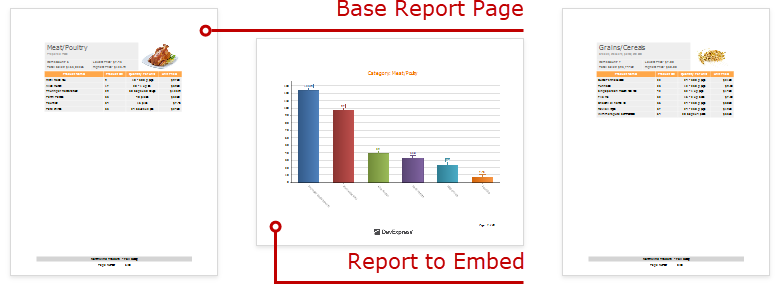
Create the Base Report
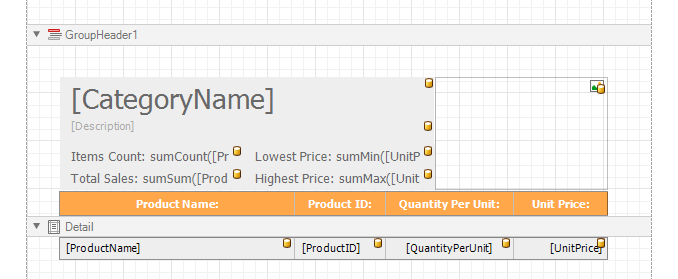
Join the Northwind database’s Products and Categories tables. Create a report bound to the resulting query, and arrange a layout like the one shown below:
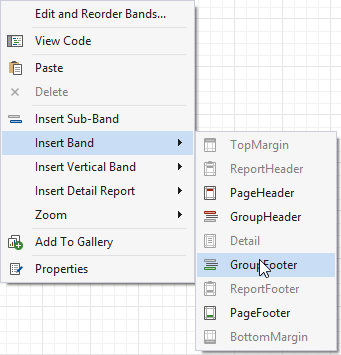
Right-click the base report’s Detail band and select the Insert Band / Group Footer item in the context menu.
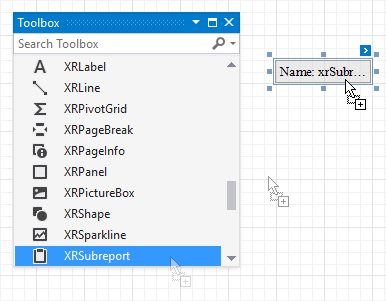
Drag an XRSubreport item from the Toolbox onto the added group footer band.
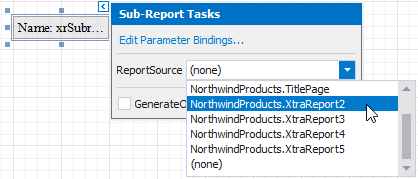
Click the subreport control’s smart tag. In the Sub-Report Tasks window, set the Report Source parameter to the chart report’s location.
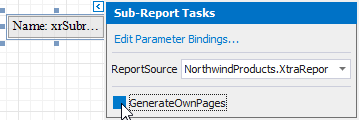
Enable the GenerateOwnPages option to print the embedded report on separate pages and use its own page settings.
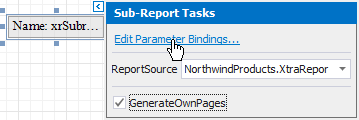
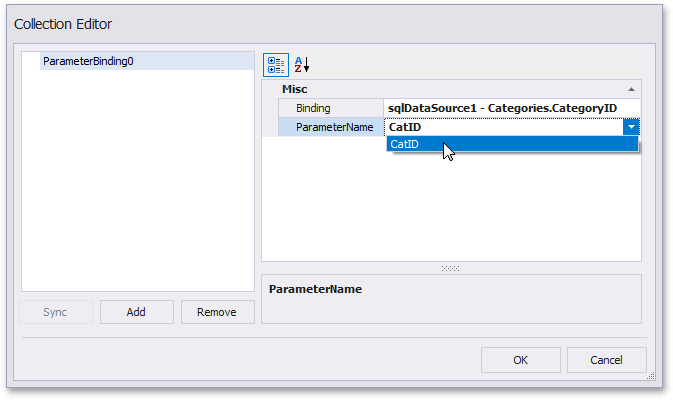
Bind the chart report’s CatID parameter to the base report’s CategoryID data field. Click the subreport’s smart tag and select Edit Parameter Bindings in the invoked SubReport Tasks window.
The Parameter Bindings Collection Editor is invoked. Click Add to add a new binding. In the binding properties list, specify the data field to bind to and the parameter name to bind.
Switch to Preview mode to see the combined report.
Your base report’s Table of Contents and Document Map include bookmarks from the embedded report. Use the XRSubreport.BookmarkParent property to specify the nesting level for the embedded report’s bookmarks.