Use Charts in Reports
- 3 minutes to read
This topic describes how to embed a chart into a report.
Chart Overview
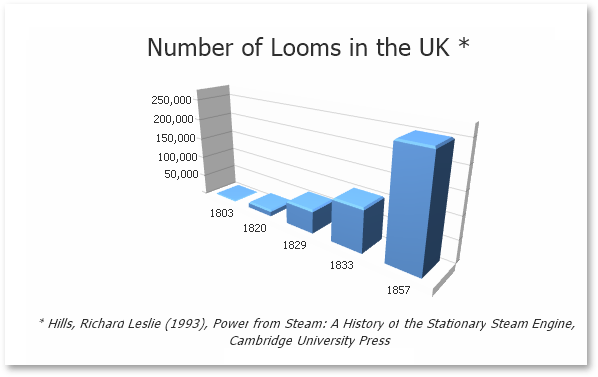
You can use the XRChart control to add a chart to a report. This control provides 2D or 3D views to visualize data series.
| 2D Series View | 3D Series View |
|---|---|
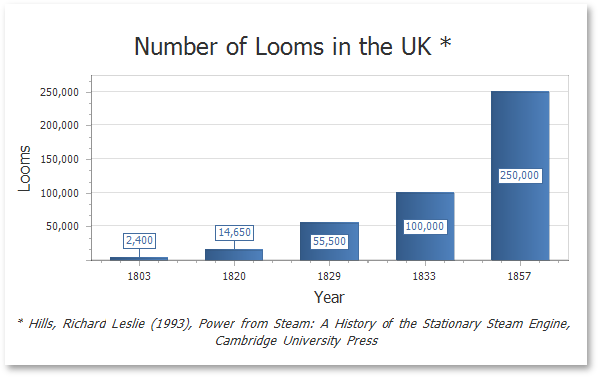 |
 |
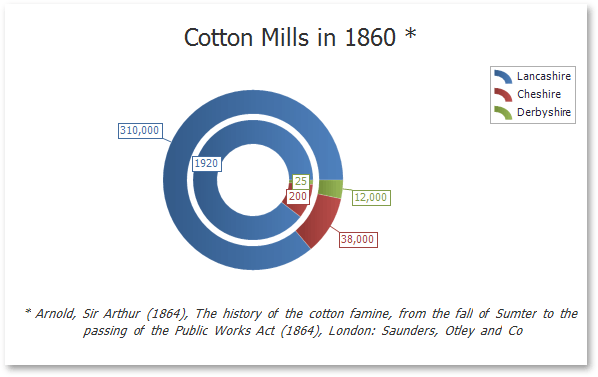
The XRChart control can display multiple series.
| Bar and Point Series | Nested Doughnut Series |
|---|---|
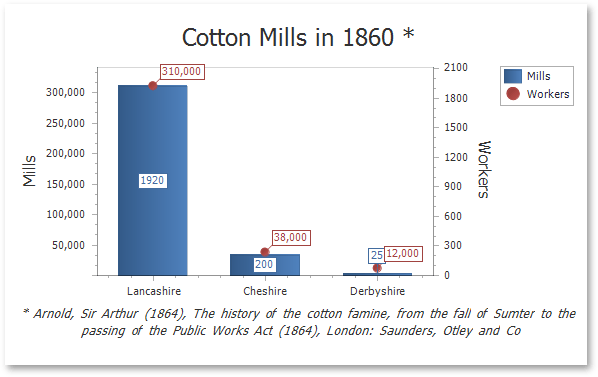 |
 |
The XRChart control contains various visual elements (diagrams, series, legends, primary and secondary axes, titles and labels, etc.). You can select these elements in the Report Designer and customize their settings in the Property Grid. Refer to the XRChart class description in the API Reference documentation section for more information on these settings.
The desktop and web End-User Report Designer versions provide the Chart Designer that allow end users to create and customize charts.
End-User Report Designer for ASP.NET
End-User Report Designer for WinForms
End-User Report Designer for WPF
You can use the XRChart control in reports only. Use the following controls to embed charts elsewhere in your application:
| Platform | Chart Control Class | Documentation |
|---|---|---|
| ASP.NET | WebChartControl | Chart Control (ASP.NET) |
| Windows Forms | ChartControl | Chart Control (WinForms) |
| WPF | ChartControl and Chart3DControl | Charts Suite (WPF) |
Note
The XRChart control is implemented the same way as the chart controls listed in the table above. Refer to these controls’ documentation for information about possible chart configurations and the XRChart class’s description for instructions on how to apply these configurations in reports.
Bind a Chart to Data
To bind data to a chart, use the XRChart.DataSource property.
Tip
You can assign a Pivot Grid to a chart’s data source. This allows the XRPivotGrid to supply data to the chart. Refer to the Link a Chart and a Pivot Grid topic for details.
When the chart data source is not assigned, the chart obtains data from the report’s data source (assigned to the XtraReportBase.DataSource property). A chart can display report data in the following ways:
- Place a chart on the report header/footer band to display a summary for the detail report data.
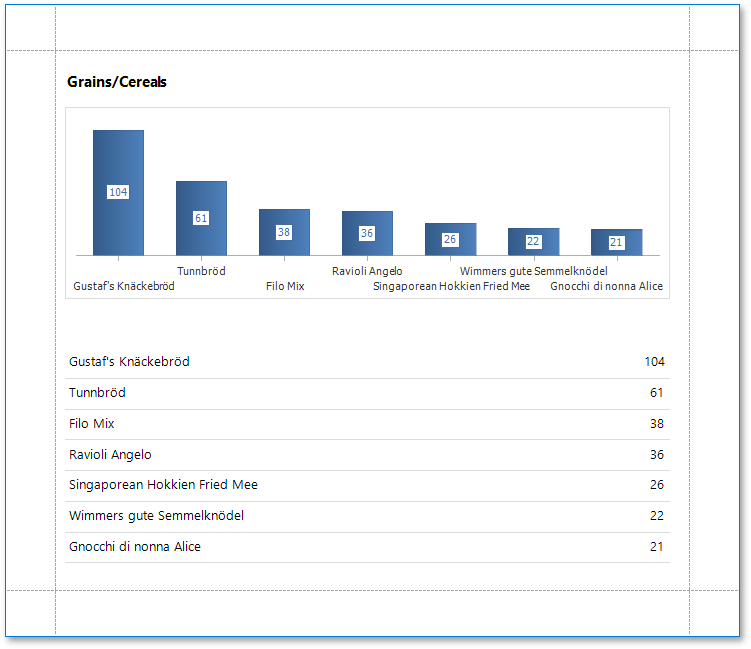
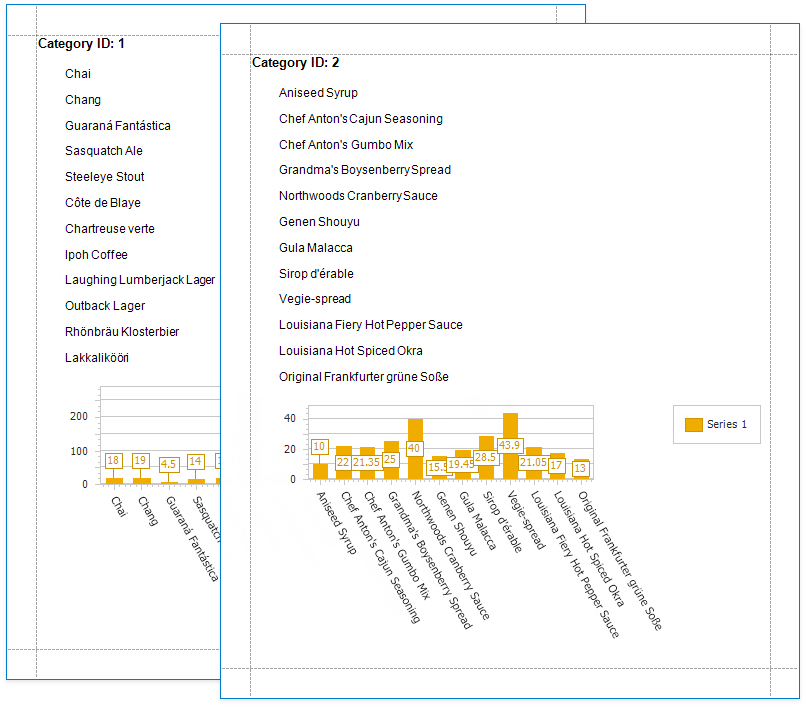
- Place a chart on a group header/footer to visualize data in each report group. Refer to the Use Charts to Visualize Data in Report Groups step-by-step tutorial for more information.
- The chart in the Detail band is printed as many times as there are records in the report’s data source. You can use a custom progress bar control instead of the chart control to visualize report detail data.
Specify the following settings to provide data to a chart’s series.
- The SeriesBase.ArgumentDataMember property specifies the data field that provides point arguments.
- The SeriesBase.ValueDataMembers property specifies the data fields that supply point values.
You can specify these settings in the following ways:
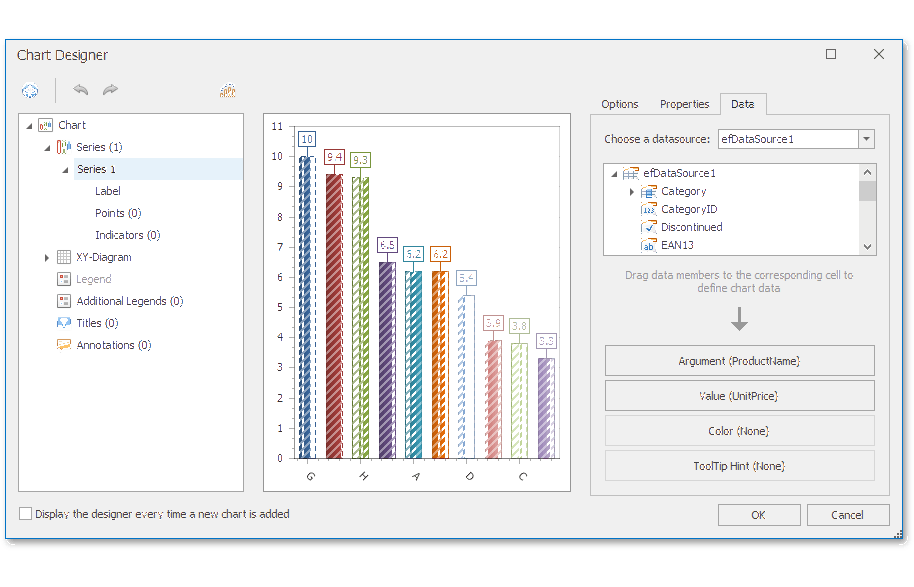
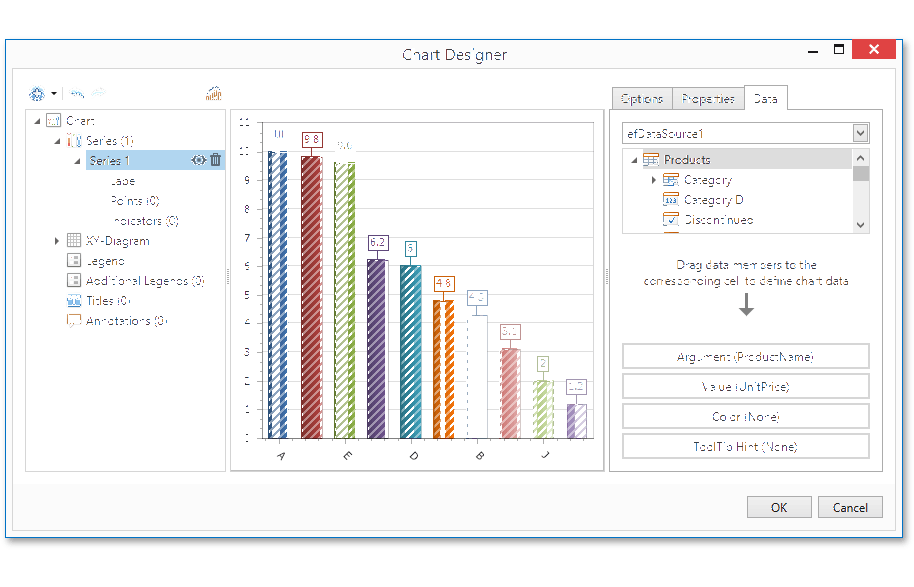
Bind each series individually
Add a new series to the chart’s XRChart.Series collection and specify the argument and value data members. Refer to the Add a Chart (Set Up Series Manually) step-by-step tutorial for details.
Create series dynamically
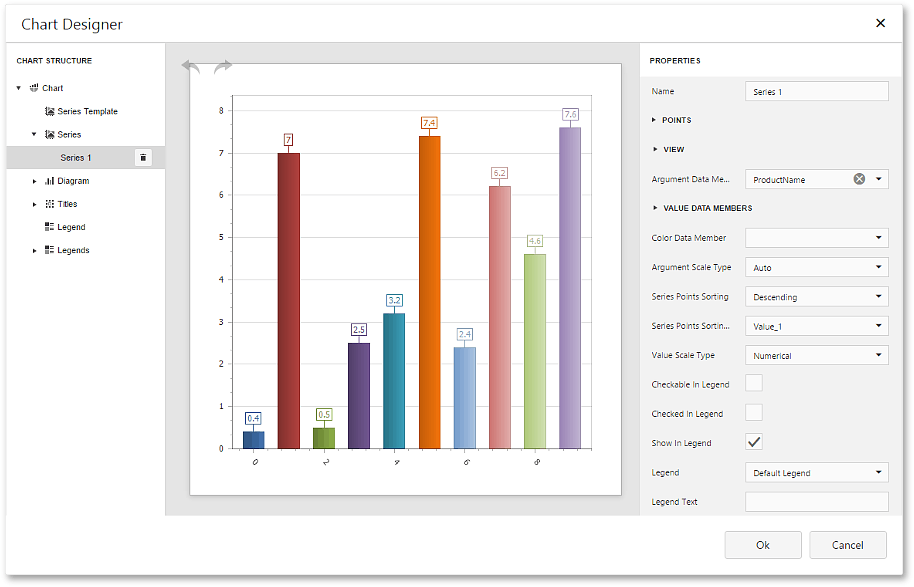
Assign the data field that contains series names to the XRChart.SeriesDataMember property and specify the argument and value data members of the SeriesBase object the XRChart.SeriesTemplate property returns. Refer to the Add a Chart (Use a Series Template) step-by-step tutorial for more information.
The data members assigned to the series argument and values should match the data types that the SeriesBase.ArgumentScaleType and SeriesBase.ValueScaleType properties specify.
Tip
See the WinForms Charts Documentation to learn more about a chart’s configuration.