Lesson 6 - Group Report Data and Calculate Summaries
- 5 minutes to read
This step describes how to group and sort the tutorial’s report data, and calculate summaries.
Note
Watch the Video: Reporting: Grouping and Summaries (YouTube)
Group and Sort Report Data
Do the following to group the report data:
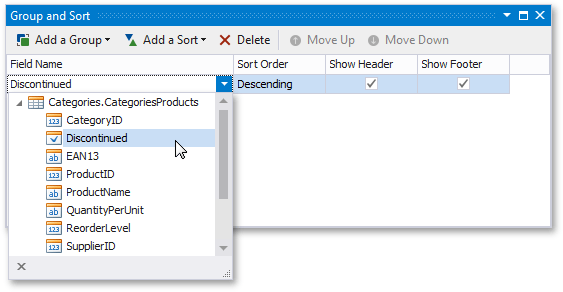
Switch to the Group and Sort panel.
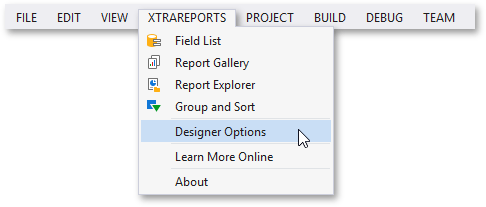
If this window is closed, you can open it using the XtraReports Menu:
On this panel, click Add a Group and select a data field to use as grouping criteria.
- Specify the sort order (Descending or Ascending). Select None if no sorting is required (for instance, when the data is already sorted at the data source level).
- Enable both the Show Header and Show Footer options to create a corresponding pair of grouping bands.
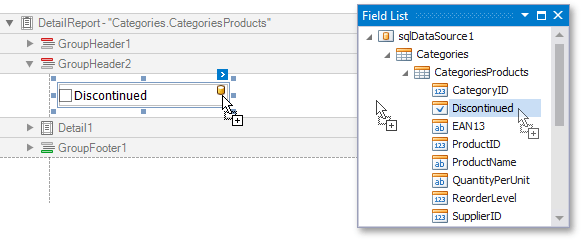
Switch to the Field List and drop the data field that was previously defined as grouping criteria onto the created Group Header.
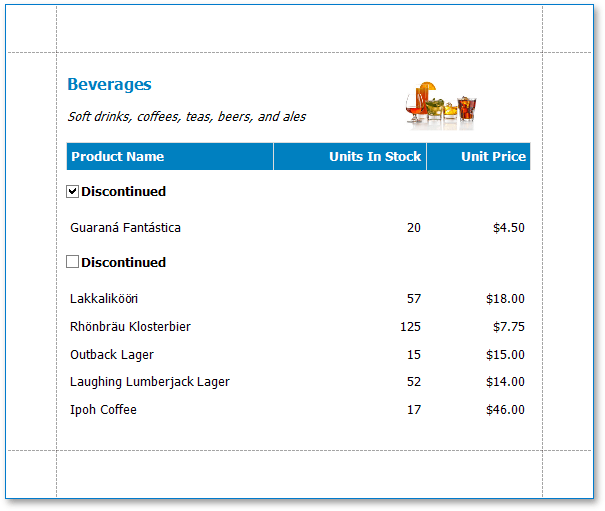
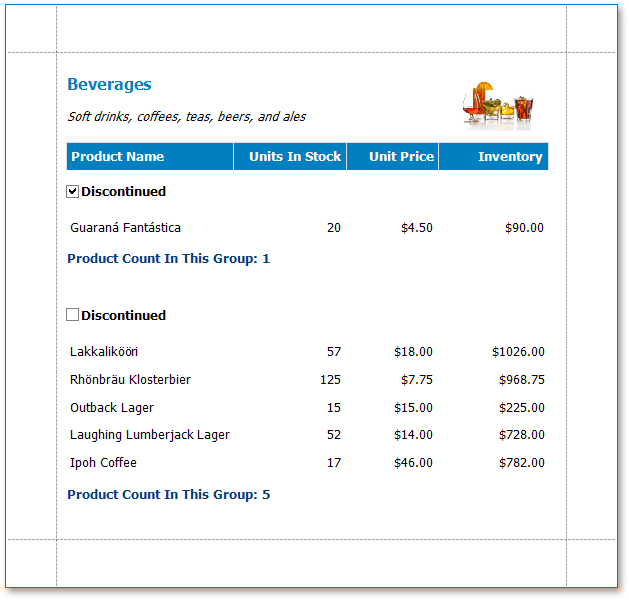
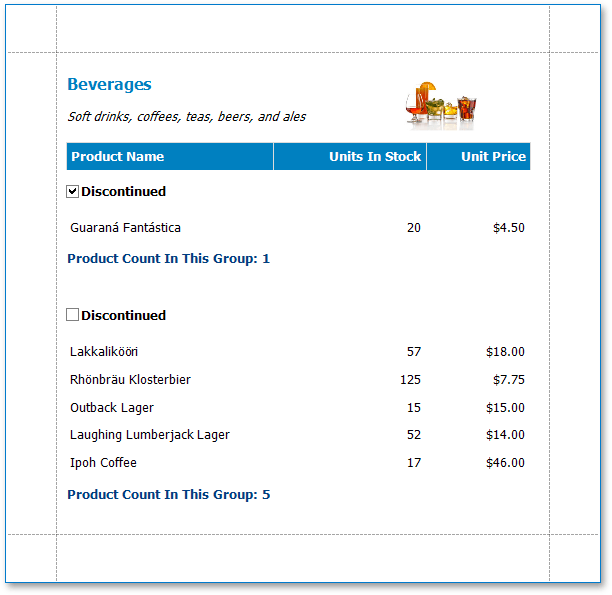
Switch to the Preview tab and view the result. The detail report data is grouped based on the grouping criteria value.
The created Group Footer can be used to display totals under each group, which is described l later in this tutorial.
Calculate Summaries (Using Expression Bindings)
This section illustrates how to calculate various summaries across a report and its groups.
Note
You can use the approach described in this section when UserDesignerOptions.DataBindingMode is set to DataBindingMode.Expressions or DataBindingMode.ExpressionsAdvanced.
See the next section to learn about the legacy approach to calculating summaries.
Drop the label control from the Toolbox onto the Group Footer band.
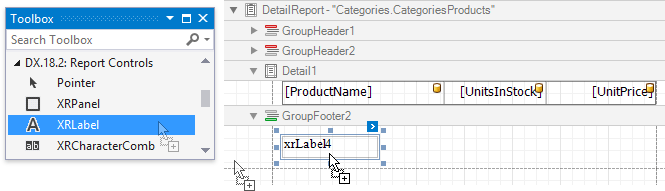
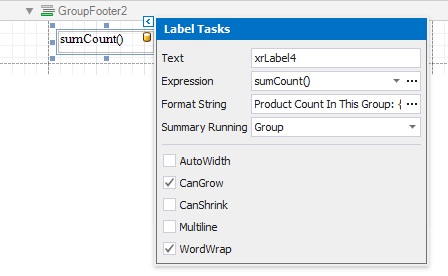
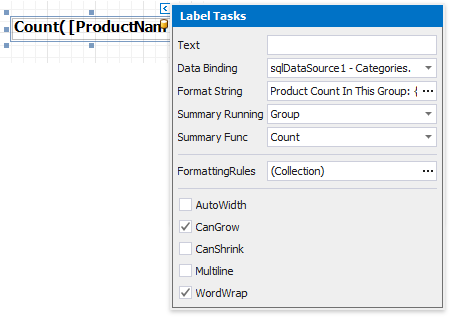
Click the label’s smart tag and set the Summary Running property to Group to calculate summaries across report groups. Click the Expression property’s ellipsis button, and in the invoked Expression Editor, specify the following expression to calculate the number of records in each group:
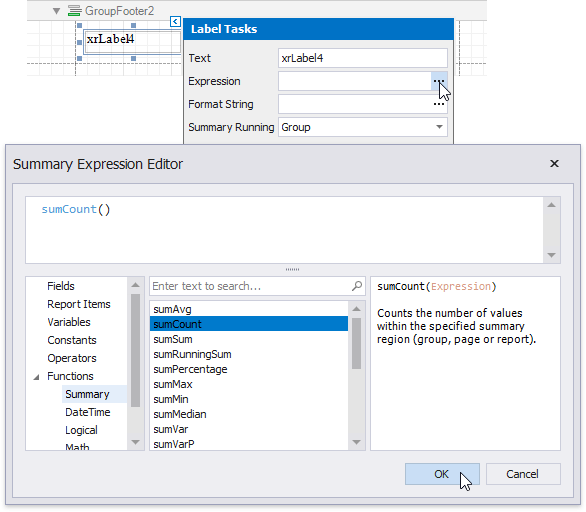
Use the Format String property to format the summary’s value (for instance, set it to Product Count In This Group: {0}.
Right-click the table located on the Detail band and add a new column to it.
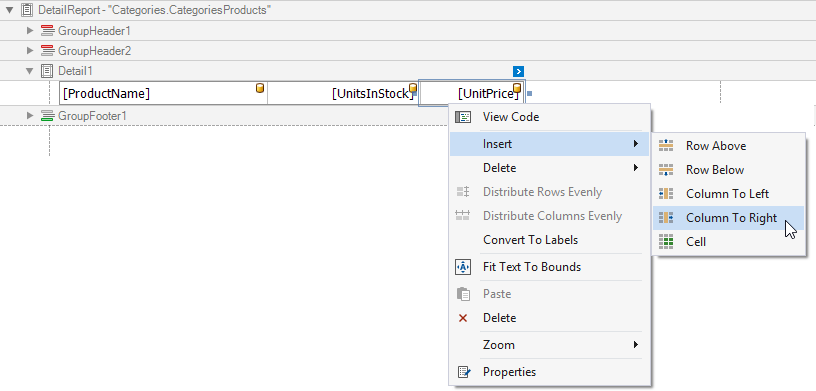
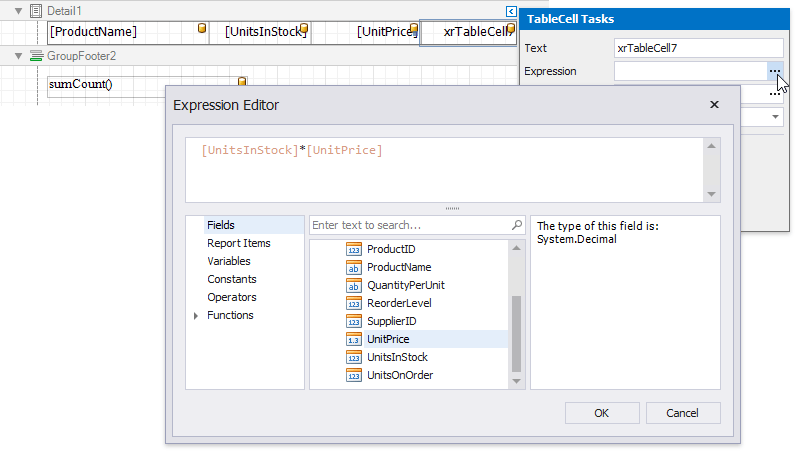
Click the created cell’s smart tag and click the Expression property’s ellipsis button. In the Expression Editor, switch to the Fields section and specify the expression that calculates the product of two numeric data fields (UnitsInStock and UnitPrice).
- Format to the created cell as currency and add a corresponding caption (for instance, “Inventory“) to the table header.
Switch to the Preview tab and view the result. You can see the total count of products under each group and the product of UnitsInStock and UnitPrice values in the Inventory column.
Calculate Summaries (Legacy Approach)
This section illustrates how to calculate totals across report groups and how to evaluate other summaries using calculated fields.
Note
You can use the approach described in this section to calculate summaries when UserDesignerOptions.DataBindingMode is set to DataBindingMode.Bindings.
See the previous section to learn about solving this task using expression bindings.
Calculate Totals
Do the following to display the number of entries in each report group:
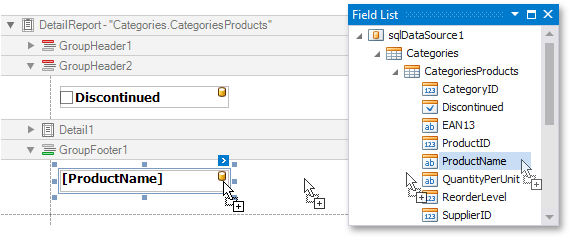
Switch to the Field List and drop the ProductName field onto the Group Footer to use the created control for displaying group totals.
This control can be bound to any other data field from the same table.
Click the control’s smart tag and specify the following options:
Summary Running (XRSummary.Running)
Specifies the range across which to calculate the total (a Page, Group or Report).
When the None option is selected, no summary is calculated, and the control displays its bound data field’s current value.
Summary Func (XRSummary.Func)
Specifies the function to calculate. See the Expression Constants, Operators, and Functions topic for a complete list of supported functions.
This option is enabled only if the Summary Running property is set to a value other than None.
Format String (XRLabel.TextFormatString)
Applies a format string to the summary result.
You can also use the XRSummary.IgnoreNullValues option (for instance, in the Property Grid) to specify whether to include null (empty) database records when calculating the total.
Switch to the Preview tab and view the result. The total number of products is displayed under each group.
Use Calculated Fields
You can process report data in various ways using calculated fields. A calculated field’s expression may include numerous aggregate, date-time, logical, math and string functions that you can apply to specific constants or data fields.
The following steps illustrate how to calculate the product of two numeric data fields:
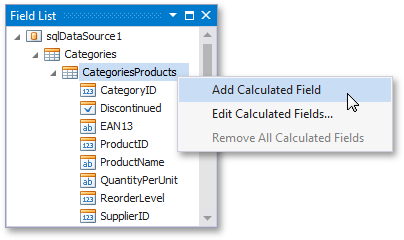
Switch to the Field List and right-click the table containing the target data fields. In the invoked context menu, select Add Calculated Field.
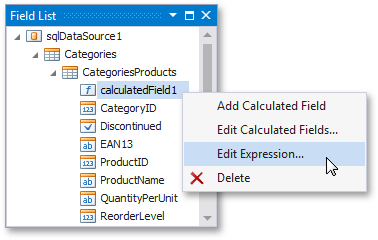
Right-click the created field and select Edit Expression in the context menu.
In the invoked Expression Editor, switch to the Fields section and specify the required expression based on the selected data fields.
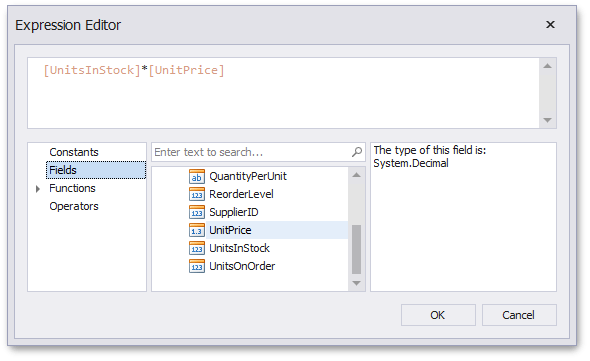
See Expression Constants, Operators, and Functions) to learn more about the expression syntax and supported functions.
Right-click the table located on the Detail band and add a new column to it.
Switch to the Field List and drop the calculated field onto the created table cell.
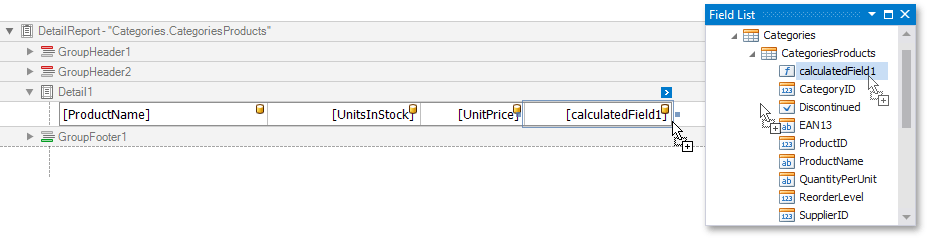
Apply a currency format to the cell bound to the calculated field and add a corresponding caption (for instance, “Inventory“) to the table header.
Switch to the Preview tab and view the result. The Inventory column displays the values calculated based on the UnitsInStock and UnitPrice values.
Next Lesson: Lesson 7 - Customize the Report Appearance