Profile Your Application
- 5 minutes to read
After you have set up the profiler, you are ready to profile your application.
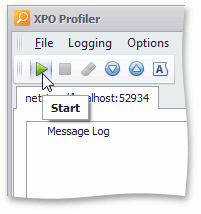
To start a profiling session for a running application, click the Start icon in the toolbar.
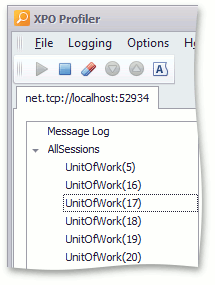
The profiler will start logging application activity. The session selector on the left side of the profiler connection window allows you to switch between viewing events for separate sessions, and the entire profiler log.
The main grid view displays the actual event log corresponding to the selected session on the right.
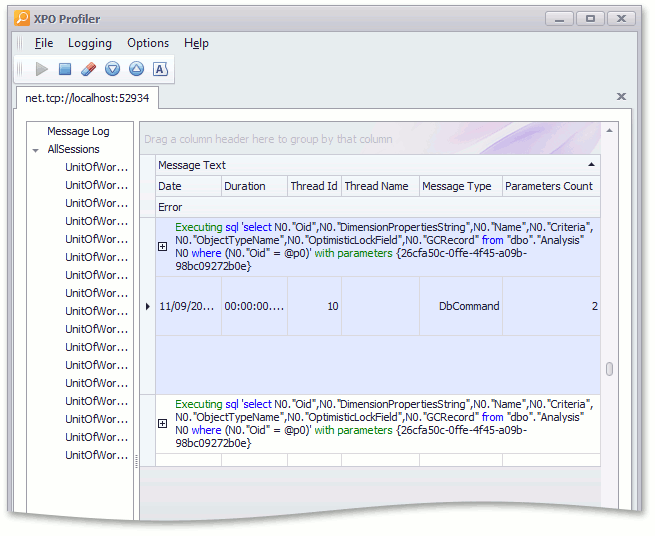
The main grid view is represented by the Data Grid control, which is highly customizable. To simplify the profiling process, you can reorder columns, create summaries, use custom filters, etc. (If you are not familiar with the capabilities of the XtraGrid control, refer to the End-User Capabilities help topic from the XtraGrid documentation.) You can also customize the grid view via profiler toolbar commands. The Expand View/Collapse View commands expand/collapse all parameter lists in the grid view. These commands are available only when Message Log is selected in the session selector. The Short Text command enables a short text mode. In this mode, long SQL queries are truncated when displayed in the grid view. You can still see a complete SQL query in the accompanying details view. This view is displayed under the main grid view, and displays event parameters of the currently selected event.
When the profiler collects enough information on the activity of the running application, you will be able to identify the following issues.
Attempts to access a session from different threads
Base XPO classes, such as Session, XPCollection and XPObject are not thread safe. Thus, you should not use instances of these classes in threads that are different from those in which they have been created. The profiler captures thread information and displays thread identifiers in the Thread Id column of the main grid view. When a session is accessed from different threads, the profiler highlights this event in purple.
Note
The “Cross-thread session access is detected” warnings are normal in stateful ASP.NET applications. The web server internally uses several threads to process requests to a single Session object. For details, see ASP.NET Thread Usage on IIS 7.5, IIS 7.0, and IIS 6.0.
Attempts to execute requests via inappropriate data layers
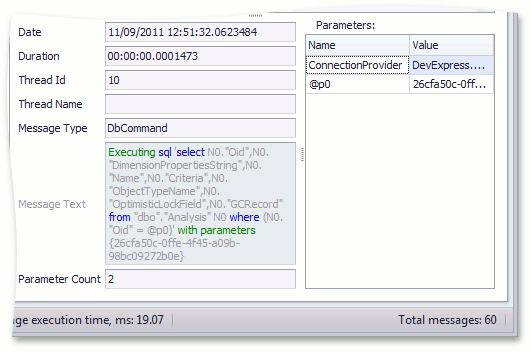
A typical example is an attempt to create a persistent object via the default constructor. In this instance, the created object will use the database connection specified via the static members of the XpoDefault class. By default, an Access database will be created for this object, which oftentimes is not what you would expect (see XPO Best Practices). When the profiler detects default constructor usage, a corresponding session event is highlighted in purple. You can also look at the ConnectionProvider parameter value of an SQL query to ensure that it uses the correct connection provider. The Practical usage section of the Profile it! blog post demonstrates the discovery of such an issue.
Incorrect usage of the query cache (DataCacheRoot / DataCacheNode)
XPO has a customizable data-level caching system (see Cached Data Store). This system caches queries along with their results when they are executed on the database server. The profiler allows you to test your application to see how your cache configuration affects an application, what queries are retrieved from the cache, and what queries are executed by the SQL server. With this information, you can fine-tune the cache system or find associated issues.
Inefficient implementations of methods manipulating database data
Your application can have data methods that are implemented in ways that are less than optimal. Generally, these can be methods that include complex data manipulations. This can be, for instance, a calculated property get accessor. Such methods might make hundreds of SQL queries when only a couple of them are required. There are no general solutions for diagnosing these issues, and the recommended approach is to profile the application execution to look for excessive SQL queries. The Profiling an XAF application with XPO Profiler webinar demonstrates a problematic method, its discovery and its correction.
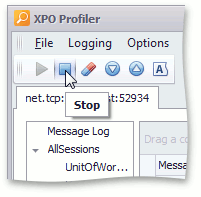
When you have gathered enough information and wish to finish profiling, stop the profiling session by clicking the Stop icon in the toolbar.
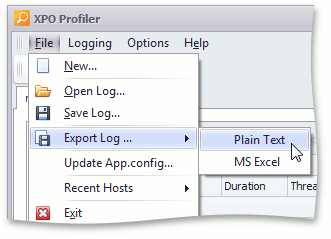
To save the collected profiler logs and analyze them later, use the Save Log, Open Log and Export Log commands.
The profiler automatically saves grid layout customizations for each connection individually. To manage the configurations, invoke the Options menu that contains layout management commands.
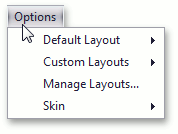
Default Layout
Use this menu to manage the default layout for new connections. You can save the current layout as the default, load the default layout, or reset it.
Custom Layout
Use this menu to name the current layout and save it for future use, or load an existing custom layout.
Manage Layouts…
Use this menu to see all layouts saved by the profiler, as well as remove unnecessary layouts.