TreeListColumn.SummaryFooter Property
Specifies the type of the summary to calculate against all nodes.
Namespace: DevExpress.XtraTreeList.Columns
Assembly: DevExpress.XtraTreeList.v19.2.dll
Declaration
Property Value
| Type | Default | Description |
|---|---|---|
| SummaryItemType | **None** | A SummaryItemType enumerator value that specifies the summary type applied. |
Available values:
| Name | Description |
|---|---|
| Sum | Calculates the sum of field values within a group of column cells. |
| Min | Retrieves the minimum value within a group of column cells. |
| Max | Retrieves the maximum value within a group of column cells. |
| Count | Calculates the number of nodes within a group of column cells. |
| Average | Calculates the average field value within a group of column cells. |
| Custom | Allows a user to define a custom summary value by handling the TreeList.GetCustomSummaryValue event. |
| None | Summary is not calculated. |
Remarks
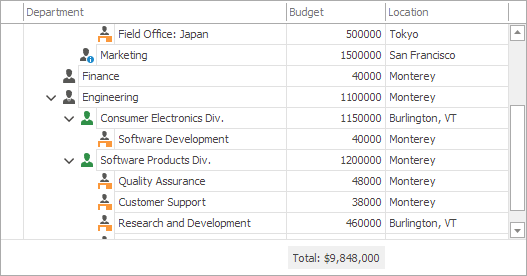
The SummaryFooter property defines the type of summary to calculate against all nodes. This summary information is displayed in the Summary Footer at the bottom of the Tree List control in the corresponding column. To display the summary footer, enable the TreeListOptionsView.ShowSummaryFooter property.
The summary format is determined by the TreeListColumn.SummaryFooterStrFormat string.
If the TreeListColumn.AllNodesSummary property is set to false, the summary is calculated only against root nodes. If the AllNodesSummary is true, the summary is calculated against root nodes and all their children.
To calculate summary information against children of every node, use the TreeListColumn.RowFooterSummary property.
Example
The following example demonstrates how to calculate the Budget column’s sum. The TreeListColumn.SummaryFooter and TreeListColumn.SummaryFooterStrFormat properties specify the function type and summary value formatting.
The TreeListColumn.AllNodesSummary property is set to true to calculate the summary across all nodes within the control. The TreeListOptionsView.ShowSummaryFooter option is enabled to display the summary footer.
using DevExpress.XtraTreeList;
using DevExpress.XtraTreeList.Columns;
// ...
treeList1.OptionsView.ShowSummaryFooter = true;
TreeListColumn column = treeList1.Columns["Budget"];
column.AllNodesSummary = true;
column.SummaryFooterStrFormat = "Total: {0:c0}";
column.SummaryFooter = SummaryItemType.Sum;
Example
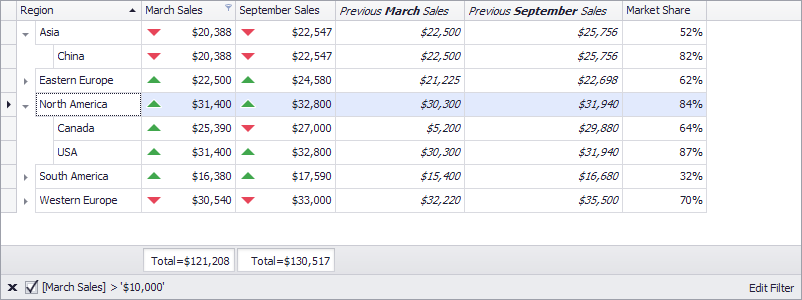
The following example creates a TreeList at runtime and shows how to perform basic customization tasks:
- Bind the treelist to a data source
- Specify the key fields that form a hierarchy
- Access automatically created columns
- Set a custom row height
- Customize column captions (using HTML tags) and cell appearance settings
- Create unbound columns and create Excel-style format conditions based on these column values
- Assign an in-place editor (a spin editor) to columns
- Sort data
- Calculate total summaries
- Filter nodes
- Hide columns and calculate column “best” widths
- Locate and expand nodes
- Focus a specific cell
- Specify DataAnnotation attributes at the data source level (the “p0” display format for the MarketShare field)
using DevExpress.XtraEditors;
using DevExpress.XtraEditors.Repository;
using DevExpress.XtraTreeList;
using DevExpress.XtraTreeList.Columns;
using DevExpress.XtraTreeList.Nodes;
using DevExpress.XtraTreeList.StyleFormatConditions;
using System;
using System.Collections.Generic;
using System.ComponentModel.DataAnnotations;
using System.Windows.Forms;

namespace TreeList_example {
    public partial class Form1 : Form {
        public Form1() {
            InitializeComponent();
        }

        private void Form1_Load(object sender, EventArgs e) {
            TreeList treeList1 = new TreeList();
            treeList1.Parent = this;
            treeList1.Dock = DockStyle.Fill;
            //Specify the fields that arrange underlying data as a hierarchy.
            treeList1.KeyFieldName = "ID";
            treeList1.ParentFieldName = "RegionID";
            //Allow the treelist to create columns bound to the fields the KeyFieldName and ParentFieldName properties specify.
            treeList1.OptionsBehavior.PopulateServiceColumns = true;
            //Specify the data source.
            treeList1.DataSource = SalesDataGenerator.CreateData();
            //The treelist automatically creates columns for the public fields found in the data source.
            //You do not need to call the TreeList.PopulateColumns method unless the treeList1.OptionsBehavior.AutoPopulateColumns option is disabled.

            //Change the row height.
            treeList1.RowHeight = 23;

            //Access the automatically created columns.
            TreeListColumn colRegion = treeList1.Columns["Region"];
            TreeListColumn colMarchSales = treeList1.Columns["MarchSales"];
            TreeListColumn colSeptemberSales = treeList1.Columns["SeptemberSales"];
            TreeListColumn colMarchSalesPrev = treeList1.Columns["MarchSalesPrev"];
            TreeListColumn colSeptemberSalesPrev = treeList1.Columns["SeptemberSalesPrev"];
            TreeListColumn colMarketShare = treeList1.Columns["MarketShare"];

            //Hide the key columns. An end-user can access them from the Customization Form.
            treeList1.Columns[treeList1.KeyFieldName].Visible = false;
            treeList1.Columns[treeList1.ParentFieldName].Visible = false;

            //Format column headers and cell values.
            colMarchSalesPrev.Caption = "<i>Previous <b>March</b> Sales</i>";
            colSeptemberSalesPrev.Caption = "<i>Previous <b>September</b> Sales</i>";
            treeList1.OptionsView.AllowHtmlDrawHeaders = true;
            colMarchSalesPrev.AppearanceCell.Font = new System.Drawing.Font(colMarchSalesPrev.AppearanceCell.Font, System.Drawing.FontStyle.Italic);
            colSeptemberSalesPrev.AppearanceCell.Font = new System.Drawing.Font(colSeptemberSalesPrev.AppearanceCell.Font, System.Drawing.FontStyle.Italic);

            //Create two hidden unbound columns that calculate their values from expressions.
            TreeListColumn colUnboundMarchChange = treeList1.Columns.AddField("FromPrevMarchChange");
            colUnboundMarchChange.Caption = "Change from prev March";
            colUnboundMarchChange.UnboundType = DevExpress.XtraTreeList.Data.UnboundColumnType.Decimal;
            colUnboundMarchChange.UnboundExpression = "[MarchSales]-[MarchSalesPrev]";
            TreeListColumn colUnboundSeptemberChange = treeList1.Columns.AddField("FromPrevSepChange");
            colUnboundSeptemberChange.Caption = "Change from prev September";
            colUnboundSeptemberChange.UnboundType = DevExpress.XtraTreeList.Data.UnboundColumnType.Decimal;
            colUnboundSeptemberChange.UnboundExpression = "[SeptemberSales]-[SeptemberSalesPrev]";
            colUnboundMarchChange.OptionsColumn.ShowInCustomizationForm = false;
            colUnboundSeptemberChange.OptionsColumn.ShowInCustomizationForm = false;

            //Make the Region column read-only.
            colRegion.OptionsColumn.ReadOnly = true;

            //Sort data against the Region column
            colRegion.SortIndex = 0;

            //Apply a filter.
            treeList1.ActiveFilterString = "[MarchSales] > 10000";

            //Calculate two total summaries against root nodes.
            colMarchSales.SummaryFooter = DevExpress.XtraTreeList.SummaryItemType.Sum;
            colMarchSales.SummaryFooterStrFormat = "Total={0:c0}";
            colMarchSales.AllNodesSummary = false;
            colSeptemberSales.SummaryFooter = DevExpress.XtraTreeList.SummaryItemType.Sum;
            colSeptemberSales.SummaryFooterStrFormat = "Total={0:c0}";
            colSeptemberSales.AllNodesSummary = false;
            treeList1.OptionsView.ShowSummaryFooter = true;

            //Use a 'SpinEdit' in-place editor for the *Sales columns.
            RepositoryItemSpinEdit riSpinEdit = new RepositoryItemSpinEdit();
            riSpinEdit.DisplayFormat.FormatType = DevExpress.Utils.FormatType.Numeric;
            riSpinEdit.DisplayFormat.FormatString = "c0";
            treeList1.RepositoryItems.Add(riSpinEdit);
            colMarchSales.ColumnEdit = riSpinEdit;
            colMarchSalesPrev.ColumnEdit = riSpinEdit;
            colSeptemberSales.ColumnEdit = riSpinEdit;
            colSeptemberSalesPrev.ColumnEdit = riSpinEdit;

            //Apply Excel-style formatting: display predefined 'Up Arrow' and 'Down Arrow' icons based on the unbound column values.
            TreeListFormatRule rule1 = new TreeListFormatRule();
            rule1.Rule = createThreeTrianglesIconSetRule();
            rule1.Column = colUnboundMarchChange;
            rule1.ColumnApplyTo = colMarchSales;
            TreeListFormatRule rule2 = new TreeListFormatRule();
            rule2.Rule = createThreeTrianglesIconSetRule();
            rule2.Column = colUnboundSeptemberChange;
            rule2.ColumnApplyTo = colSeptemberSales;
            treeList1.FormatRules.Add(rule1);
            treeList1.FormatRules.Add(rule2);

            //Do not stretch columns to the treelist width.
            treeList1.OptionsView.AutoWidth = false;

            //Locate a node by a value it contains.
            TreeListNode node1 = treeList1.FindNodeByFieldValue("Region", "North America");
            //Focus and expand this node.
            treeList1.FocusedNode = node1;
            node1.Expanded = true;

            //Locate a node by its key field value and expand it.
            TreeListNode node2 = treeList1.FindNodeByKeyID(32);//Node 'Asia'
            node2.Expand();

            //Calculate the optimal column widths after the treelist is shown.
            this.BeginInvoke(new MethodInvoker(delegate {
                treeList1.BestFitColumns();
            }));
        }

        FormatConditionRuleIconSet createThreeTrianglesIconSetRule() {
            FormatConditionRuleIconSet ruleIconSet = new FormatConditionRuleIconSet();
            FormatConditionIconSet iconSet = ruleIconSet.IconSet = new FormatConditionIconSet();
            FormatConditionIconSetIcon icon1 = new FormatConditionIconSetIcon();
            FormatConditionIconSetIcon icon2 = new FormatConditionIconSetIcon();
            FormatConditionIconSetIcon icon3 = new FormatConditionIconSetIcon();
            //Choose predefined icons.
            icon1.PredefinedName = "Triangles3_3.png";
            icon2.PredefinedName = "Triangles3_2.png";
            icon3.PredefinedName = "Triangles3_1.png";
            //Specify the type of threshold values.
            iconSet.ValueType = FormatConditionValueType.Number;
            //Define ranges to which icons are applied by setting threshold values.
            icon1.Value = Decimal.MinValue;
            icon1.ValueComparison = FormatConditionComparisonType.GreaterOrEqual;
            icon2.Value = 0;
            icon2.ValueComparison = FormatConditionComparisonType.GreaterOrEqual;
            icon3.Value = 0;
            icon3.ValueComparison = FormatConditionComparisonType.Greater;
            //Add icons to the icon set.
            iconSet.Icons.Add(icon1);
            iconSet.Icons.Add(icon2);
            iconSet.Icons.Add(icon3);
            return ruleIconSet;
        }
    }

    public class SalesData {
        static int UniqueID = 37;
        public SalesData() {
            ID = UniqueID++;
        }
        public SalesData(int id, int regionId, string region, decimal marchSales, decimal septemberSales, decimal marchSalesPrev, decimal septermberSalesPrev, double marketShare) {
            ID = id;
            RegionID = regionId;
            Region = region;
            MarchSales = marchSales;
            SeptemberSales = septemberSales;
            MarchSalesPrev = marchSalesPrev;
            SeptemberSalesPrev = septermberSalesPrev;
            MarketShare = marketShare;
        }
        public int ID { get; set; }
        public int RegionID { get; set; }
        public string Region { get; set; }
        public decimal MarchSales { get; set; }
        public decimal SeptemberSales { get; set; }
        public decimal MarchSalesPrev { get; set; }
        public decimal SeptemberSalesPrev { get; set; }

        [DisplayFormat(DataFormatString = "p0")]
        public double MarketShare { get; set; }
    }

    public class SalesDataGenerator {
        public static List<SalesData> CreateData() {
            List<SalesData> sales = new List<SalesData>();
            sales.Add(new SalesData(0, -1, "Western Europe", 30540, 33000, 32220, 35500, .70));
            sales.Add(new SalesData(1, 0, "Austria", 22000, 28000, 26120, 28500, .92));
            sales.Add(new SalesData(2, 0, "France", 23020, 27000, 20120, 29200, .51));
            sales.Add(new SalesData(3, 0, "Germany", 30540, 33000, 32220, 35500, .93));
            sales.Add(new SalesData(4, 0, "Spain", 12900, 10300, 14300, 9900, .82));
            sales.Add(new SalesData(5, 0, "Switzerland", 9323, 10730, 7244, 9400, .14));
            sales.Add(new SalesData(6, 0, "United Kingdom", 14580, 13967, 15200, 16900, .91));

            sales.Add(new SalesData(17, -1, "Eastern Europe", 22500, 24580, 21225, 22698, .62));
            sales.Add(new SalesData(18, 17, "Belarus", 7315, 18800, 8240, 17480, .34));
            sales.Add(new SalesData(19, 17, "Bulgaria", 6300, 2821, 5200, 10880, .8));
            sales.Add(new SalesData(20, 17, "Croatia", 4200, 3890, 3880, 4430, .29));
            sales.Add(new SalesData(21, 17, "Russia", 22500, 24580, 21225, 22698, .85));

            sales.Add(new SalesData(26, -1, "North America", 31400, 32800, 30300, 31940, .84));
            sales.Add(new SalesData(27, 26, "USA", 31400, 32800, 30300, 31940, .87));
            sales.Add(new SalesData(28, 26, "Canada", 25390, 27000, 5200, 29880, .64));

            sales.Add(new SalesData(29, -1, "South America", 16380, 17590, 15400, 16680, .32));
            sales.Add(new SalesData(30, 29, "Argentina", 16380, 17590, 15400, 16680, .88));
            sales.Add(new SalesData(31, 29, "Brazil", 4560, 9480, 3900, 6100, .10));

            sales.Add(new SalesData(32, -1, "Asia", 20388, 22547, 22500, 25756, .52));
            sales.Add(new SalesData(34, 32, "India", 4642, 5320, 4200, 6470, .44));
            sales.Add(new SalesData(35, 32, "Japan", 9457, 12859, 8300, 8733, .70));
            sales.Add(new SalesData(36, 32, "China", 20388, 22547, 22500, 25756, .82));
            return sales;
        }
    }

}