SizeLegend Class
Represents a map legend that details the meaning of Bubble sizes in a Bubble chart.
Namespace: DevExpress.XtraMap
Assembly: DevExpress.XtraMap.v20.1.dll
NuGet Package: DevExpress.Win.Map
Declaration
Remarks
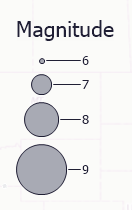
The following image shows an instance of the SizeLegend class.
To show this legend on a map, create an instance of the SizeLegend class and add it to the MapControl.Legends collection. Then, assign the required Vector Items layer to the ItemsLayerLegend.Layer property of the legend. Note that this assigned layer should contain bubble charts, so that a legend can obtain the required information .
For more information, refer to Legends.
Example
This example demonstrates how to generate bubble charts for a map control. Do the following:
- Create a VectorItemsLayer object and add it to the map control.
- Create a BubbleChartDataAdapter object and assign it to the VectorItemsLayer.Data property.
- Generate a data source with data for bubble charts and assign it to the DataSourceAdapterBase.DataSource property.
- Specify the mappings for bubble chart properties to corresponding columns in a datasource (a MapBubbleMappingInfo object that can be accessed using the BubbleChartDataAdapter.Mappings property).
- Specify the attribute mappings that are used to provide additional information about the map item to a map control.(an MapItemAttributeCollection object that can be accessed using the BubbleChartDataAdapter.Mappings property).
Note
A complete sample project is available at https://github.com/DevExpress-Examples/how-to-display-bubble-chart-items-on-a-map-t113410
    // Specify data for the bubble layer.
    BubbleLayer.Data = CreateData();
private IMapDataAdapter CreateData() {
    BubbleChartDataAdapter adapter = new BubbleChartDataAdapter() {
        DataSource = LoadData(),
        MeasureRules = CreateMeasureRules(),
        ItemMaxSize = 60,
        ItemMinSize = 10
    };

    #region #Mappings
    // Map the properties of chart items to the appropriate fields in the data source.
    adapter.Mappings.Latitude = "glat";
    adapter.Mappings.Longitude = "glon";
    adapter.Mappings.Value = "mag";
    #endregion #Mappings

    // Create attribute mappings to provide additional information about map items to the map.
    adapter.AttributeMappings.Add(new MapItemAttributeMapping("Magnitude", "mag"));
    adapter.AttributeMappings.Add(new MapItemAttributeMapping("Year", "yr"));
    adapter.AttributeMappings.Add(new MapItemAttributeMapping("Month", "mon"));
    adapter.AttributeMappings.Add(new MapItemAttributeMapping("Day", "day"));
    adapter.AttributeMappings.Add(new MapItemAttributeMapping("Depth", "dep"));

    return adapter;
}

private DataTable LoadData() {
    DataSet ds = new DataSet();
    ds.ReadXml(dataPath);
    DataTable dt = ds.Tables[0];
    dt.DefaultView.RowFilter = string.Format(CultureInfo.InvariantCulture, "(mag >= {0}) AND (mag <= {1})", minMagnitude, maxMagnitude);

    return ds.Tables[0];
}

private MeasureRules CreateMeasureRules() {
    MeasureRules measureRules = new MeasureRules();

    measureRules.ApproximateValues = true;
    measureRules.RangeDistribution = new LinearRangeDistribution();

    for (int i = minMagnitude; i < maxMagnitude; i++) {
        measureRules.RangeStops.Add(i);
    }

    return measureRules;
}