DateTimeChartRangeControlClientGridOptions.GridAlignment Property
Gets or sets the date-time measure unit to which the chart’s gridlines and labels should be aligned.
Namespace: DevExpress.XtraEditors
Assembly: DevExpress.XtraEditors.v19.2.dll
Declaration
[XtraSerializableProperty]
public RangeControlDateTimeGridAlignment GridAlignment { get; set; }Property Value
| Type | Description |
|---|---|
| RangeControlDateTimeGridAlignment | A RangeControlDateTimeGridAlignment enumeration value that represents the measurement unit to which the chart’s gridlines and labels should be aligned. |
Available values:
| Name | Description |
|---|---|
| Millisecond | Specifies a millisecond as the date-time unit to which chart grid lines should be aligned. |
| Second | Specifies a second as the date-time unit to which chart gridlines should be aligned. |
| Minute | Specifies a minute as the date-time unit to which chart grid lines should be aligned. |
| Hour | Specifies an hour as the date-time unit to which chart grid lines should be aligned. |
| Day | Specifies a day as the date-time unit to which chart gridlines should be aligned. |
| Week | Specifies a week as the date-time unit to which chart grid lines should be aligned. |
| Month | Specifies a month as the date-time unit to which chart grid lines should be aligned. |
| Year | Specifies a year as the date-time unit to which chart grid lines should be aligned. |
Property Paths
You can access this nested property as listed below:
| Object Type | Path to GridAlignment |
|---|---|
| DateTimeChartRangeControlClient |
|
Remarks
This property is available via the DateTimeChartRangeControlGridOptions object which is accessed using the DateTimeChartRangeControlClient.GridOptions property.
The following images demonstrate the GridAlignment property in action for the random function.
| GridAlignment = Week |
|---|
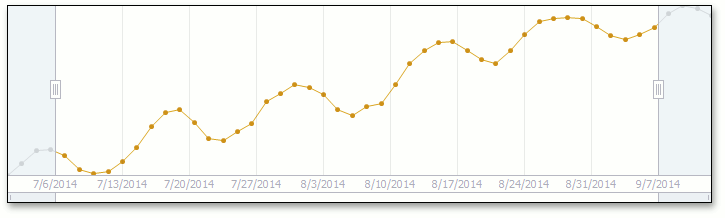 |
| GridAlignment = Month |
|---|
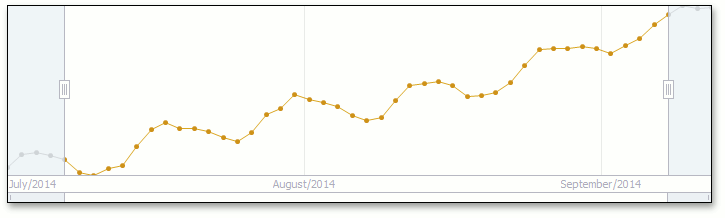 |
Example
This example demonstrates how to set up a range control with the date-time chart client to display a chart with date-time data in the range control’s background.
In order to provide data to a chart date-time range control client, you need to access the ChartRangeControlClientDataProvider object using the ChartRangeControlClientBase.DataProvider property and assign a data source to the ChartRangeControlClientDataProvider.DataSource property. Then specify the required data fields via the ChartRangeControlClientDataProvider.ArgumentDataMember, ChartRangeControlClientDataProvider.ValueDataMember, and ChartRangeControlClientDataProvider.SeriesDataMember (optional) properties.
In the current example, a date-time chart client is bound to a simple data table containing three columns (“Argument”, “Value”, and “Series”).
In addition, this example shows how to customize chart client common settings (e.g., change the date-time range, customize template view and grid options).
Note
A complete sample project is available at https://github.com/DevExpress-Examples/how-to-bind-a-date-time-chart-range-control-client-to-a-datasource-and-customize-its-commo-t125884
using System;
using System.Data;
using System.Drawing;
using System.Windows.Forms;
using DevExpress.XtraEditors;

namespace DateTimeChartRangeClient {

    public partial class Form1 : Form {

        public Form1() {
            InitializeComponent();

            // Assign a date-time chart client to the Range control.
            rangeControl1.Client = dateTimeChartRangeControlClient1;

            // Generate a data table and bind the date-time client to it.
            dateTimeChartRangeControlClient1.DataProvider.DataSource = CreateChartData(50, 2);

            // Specify data members to bind the client.
            dateTimeChartRangeControlClient1.DataProvider.ArgumentDataMember = "Argument";
            dateTimeChartRangeControlClient1.DataProvider.ValueDataMember = "Value";
            dateTimeChartRangeControlClient1.DataProvider.SeriesDataMember = "Series";

            // Specify the chart range control client view.
            AreaChartRangeControlClientView areaView = new AreaChartRangeControlClientView();
            dateTimeChartRangeControlClient1.DataProvider.TemplateView = areaView;

            // Customize the area view appearance.
            areaView.AreaOpacity = 90;
            areaView.Color = Color.Aqua;
            areaView.ShowMarkers = true;
            areaView.MarkerSize = 5;
            areaView.MarkerColor = Color.Red;

            // Format labels of the date-time chart range control client.
            dateTimeChartRangeControlClient1.GridOptions.LabelFormat = "D";

            // Specify the palette name to get a nice-looking chart.
            dateTimeChartRangeControlClient1.PaletteName = "Office";

            // Customize grid alignment, grid spacing, snap spacing and snap alignment of the chart range control client.
            dateTimeChartRangeControlClient1.GridOptions.GridAlignment = RangeControlDateTimeGridAlignment.Day;
            dateTimeChartRangeControlClient1.GridOptions.GridSpacing = 1;
            dateTimeChartRangeControlClient1.GridOptions.SnapSpacing = 1;
            dateTimeChartRangeControlClient1.GridOptions.SnapAlignment = RangeControlDateTimeGridAlignment.Week;

            // Change the date-time range of the chart range control client.
            dateTimeChartRangeControlClient1.Range.Min = DateTime.Now;
            dateTimeChartRangeControlClient1.Range.Max = DateTime.Now.AddDays(50);
        }

        private DataTable CreateChartData(int pointCount, int seriesCount) {

            // Create an empty table.
            DataTable table = new DataTable("Table1");

            // Add three columns to the table.
            table.Columns.Add("Argument", typeof(DateTime));
            table.Columns.Add("Value", typeof(Double));
            table.Columns.Add("Series", typeof(string));

            // Add data rows to the table.
            Random rand = new Random((int)DateTime.Now.Ticks);
            DataRow row = null;
            double value = 0;

            for (int seriesIndex = 0; seriesIndex < seriesCount; seriesIndex++) {
                for (int pointIndex = 0; pointIndex < pointCount; pointIndex++) {
                    value += (rand.NextDouble() - 0.3);
                    row = table.NewRow();
                    row["Argument"] = DateTime.Now.Date.AddDays(pointIndex);
                    row["Value"] = Math.Sin(pointIndex) + value;
                    row["Series"] = seriesIndex.ToString();
                    table.Rows.Add(row);
                }
            }
            return table;
        }
    }
}