ChartRangeControlClientDataProvider.TemplateView Property
Specifies a chart client template view type for the range control.
Namespace: DevExpress.XtraEditors
Assembly: DevExpress.XtraEditors.v23.2.dll
NuGet Package: DevExpress.Win.Navigation
Declaration
Property Value
| Type | Description |
|---|---|
| ChartRangeControlClientView | A ChartRangeControlClientView object descendant that is the chart client view type. |
Remarks
Use the TemplateView property to specify a chart client view to display numeric or date-time data as lines or areas.
To specify the TemplateView property for the chart range control client, you should access the ChartRangeControlClientDataProvider object using the ChartRangeControlClientBase.DataProvider property.
The following table lists the available view types of the numeric chart range control client.
| View Type | Image | Description |
|---|---|---|
| AreaChartRangeControlClientView | 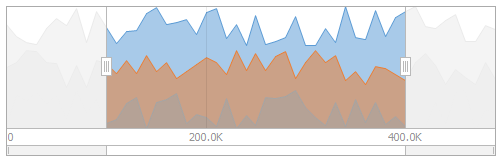 |
An area chart. |
| LineChartRangeControlClientView |  |
A line chart. |
Note that chart clients show a Line view by default.
Example
This example shows how to bind a numeric chart range control client to a System.Collections.Generic.List containing NumericItem objects.
In order to provide data to a chart numeric range control client, you need to access the ChartRangeControlClientDataProvider object using the ChartRangeControlClientBase.DataProvider property and assign a data source to the ChartRangeControlClientDataProvider.DataSource property.
Each NumericItem object contains Argument, Value and Series properties, to which a numeric chart range control client is bound via its ChartRangeControlClientDataProvider.ArgumentDataMember, ChartRangeControlClientDataProvider.ValueDataMember, and ChartRangeControlClientDataProvider.SeriesDataMember (optional) properties.
In addition, this example shows how to customize chart client common settings (e.g., change the numeric range, customize template view and grid options).
using System;
using System.Collections.Generic;
using System.Drawing;
using System.Windows.Forms;
using DevExpress.XtraEditors;

namespace NumericChartClient {
    public partial class Form1 : Form {

        const int pointCount = 20;
        const int seriesCount = 2;
        Random rand = new Random();
        List<NumericItem> data = new List<NumericItem>();

        public Form1() {
            InitializeComponent();

            // Assign a numeric chart client to the Range control.
            rangeControl1.Client = numericChartRangeControlClient1;

            // Generate a list of NumericItem objects and bind the numeric chart client to it.
            numericChartRangeControlClient1.DataProvider.DataSource = GenerateNumericData();

            // Specify data members to bind the chart client.
            numericChartRangeControlClient1.DataProvider.ArgumentDataMember = "Argument";
            numericChartRangeControlClient1.DataProvider.ValueDataMember = "Value";
            numericChartRangeControlClient1.DataProvider.SeriesDataMember = "Series";

            // Specify the chart range control client view.
            AreaChartRangeControlClientView areaView = new AreaChartRangeControlClientView();
            numericChartRangeControlClient1.DataProvider.TemplateView = areaView;

            // Customize the area view appearance.
            areaView.AreaOpacity = 90;
            areaView.Color = Color.Gray;
            areaView.ShowMarkers = true;
            areaView.MarkerSize = 5;
            areaView.MarkerColor = Color.Red;

            // Specify the palette name to get a nice-looking chart.
            numericChartRangeControlClient1.PaletteName = "NatureColors";

            // Change the default range of the numeric chart range control client.
            numericChartRangeControlClient1.Range.Min = 4;
            numericChartRangeControlClient1.Range.Max = 12;

            // Customize the grid options of the numeric chart range control client.
            numericChartRangeControlClient1.GridOptions.GridSpacing = 2;
            numericChartRangeControlClient1.GridOptions.SnapSpacing = 1;
        }

        List<NumericItem> GenerateNumericData() {

            for (int seriesIndex = 0; seriesIndex < seriesCount; seriesIndex++) {
                for (int i = 0; i < pointCount; i++) {
                    data.Add(new NumericItem() {
                        Argument = i,
                        Value = rand.Next(0, 30) + i,
                        Series = seriesIndex
                    });
                }
            }
            return data;
        }
    }

    public class NumericItem {
        public double Argument { get; set; }
        public double Value { get; set; }
        public double Series { get; set; }
    }
}