ChartControl.PaletteBaseColorNumber Property
Gets or sets the number of a color within the selected palette, which will be used as a base color to paint series points.
Namespace: DevExpress.XtraCharts
Assembly: DevExpress.XtraCharts.v18.2.UI.dll
Declaration
Property Value
| Type | Description |
|---|---|
| Int32 | An integer value representing a 1-based color number. |
Remarks
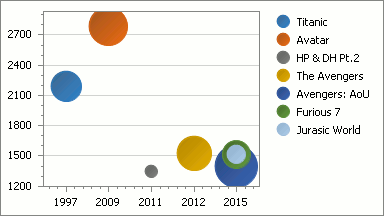
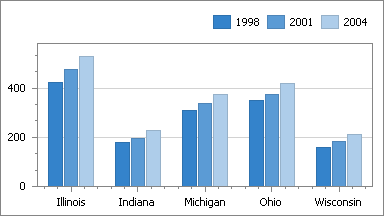
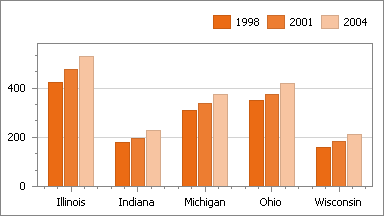
The following pictures illustrate how the PaletteBaseColorNumber property works. Note that when the PaletteBaseColorNumber property is set to 0, and the SeriesViewColorEachSupportBase.ColorEach property of a series is set to true, a palette’s colors are used to paint individual points of that series.
| PaletteBaseColorNumber = 0 | PaletteBaseColorNumber = 1 | PaletteBaseColorNumber = 3 |
|---|---|---|
 |
 |
 |
Example
This example demonstrates how to customize a chart’s appearance at runtime, via the ChartControl.AppearanceName, ChartControl.PaletteName and ChartControl.PaletteBaseColorNumber properties.
Note that you can define a separate palette for painting all indicators available in your chart, via the ChartControl.IndicatorsPaletteName property.
Note
A complete sample project is available at https://github.com/DevExpress-Examples/how-to-define-a-palette-and-appearance-to-a-chart-e2664
using System;
using System.Windows.Forms;
using DevExpress.XtraCharts;
// ...
private void Form1_Load(object sender, EventArgs e) {
    // Create an empty chart.
    ChartControl barChart = new ChartControl();

    // Create a series and add points to it.
    Series series1 = new Series("Bar Series", ViewType.Bar);
    series1.Points.Add(new SeriesPoint("A", new double[] { 10 }));
    series1.Points.Add(new SeriesPoint("B", new double[] { 12 }));
    series1.Points.Add(new SeriesPoint("C", new double[] { 14 }));
    series1.Points.Add(new SeriesPoint("D", new double[] { 17 }));

    // Create an indicator (e.g. Regression Line),
    // and add it to the series' collection.
    RegressionLine myLine = new RegressionLine(ValueLevel.Value);
    ((SideBySideBarSeriesView)series1.View).Indicators.Add(myLine);

    // Add the series to the chart.
    barChart.Series.Add(series1);

    // Define the chart's appearance and palette.
    barChart.AppearanceName = "Dark";
    barChart.PaletteName = "Opulent";
    barChart.PaletteBaseColorNumber = 5;

    // Define a separate palette for the chart's indicators.
    barChart.IndicatorsPaletteName = "Default";

    // Add the chart to the form.
    barChart.Dock = DockStyle.Fill;
    this.Controls.Add(barChart);
}
Related GitHub Examples
The following code snippet (auto-collected from DevExpress Examples) contains a reference to the PaletteBaseColorNumber property.
Note
The algorithm used to collect these code examples remains a work in progress. Accordingly, the links and snippets below may produce inaccurate results. If you encounter an issue with code examples below, please use the feedback form on this page to report the issue.