ChartControl.CustomDrawSeries Event
Occurs before a series is drawn when the chart’s contents are being drawn.
Namespace: DevExpress.XtraCharts
Assembly: DevExpress.XtraCharts.v23.2.UI.dll
NuGet Package: DevExpress.Win.Charts
Declaration
Event Data
The CustomDrawSeries event's data class is CustomDrawSeriesEventArgs. The following properties provide information specific to this event:
| Property | Description |
|---|---|
| DisposeLegendCheckBoxImage | Gets or sets the value specifying whether CustomDrawSeriesEventArgs.LegendCheckBoxImage should be disposed when drawing is finished. |
| DisposeLegendFont | Gets or sets the value specifying whether the e.DXLegendFont should be disposed when drawing is finished. Inherited from CustomDrawSeriesEventArgsBase. |
| DisposeLegendMarkerImage | Gets or sets the value specifying whether e.DXLegendMarkerImage should be disposed when drawing is finished. Inherited from CustomDrawSeriesEventArgsBase. |
| DXLegendFont | Gets or sets the text font of the legend item of the series or series point that is currently being painted. Inherited from CustomDrawSeriesEventArgsBase. |
| DXLegendMarkerImage | Gets or sets the image of the legend item marker of the series or series point that is currently being painted. Inherited from CustomDrawSeriesEventArgsBase. |
| LegendCheckBoxDXImage | Gets or sets the image of the legend item check box of the series or series point that is currently being painted. |
| LegendCheckBoxImage | Gets or sets the image of the legend item check box of the series or series point that is currently being painted. |
| LegendCheckBoxImageSizeMode | Gets or sets the image size mode of the legend item check box of the series or series point that is currently being painted. |
| LegendCheckBoxSize | Gets or sets the size of the legend item check box of the series or series point that is currently being painted. |
| LegendCheckBoxVisible | Gets or sets the visibility of the legend item check box of the series that is currently being painted. |
| LegendDrawOptions | Returns the draw settings of the legend item of the series that is currently being drawn. Inherited from CustomDrawSeriesEventArgsBase. |
| LegendFont | Gets or sets the text font of the legend item of the series or series point that is currently being painted. Inherited from CustomDrawSeriesEventArgsBase. |
| LegendMarkerImage | Gets or sets the image of the legend item marker of the series or series point that is currently being painted. Inherited from CustomDrawSeriesEventArgsBase. |
| LegendMarkerImageSizeMode | Gets or sets the image size mode of the legend item marker of the series or series point that is currently being painted. Inherited from CustomDrawSeriesEventArgsBase. |
| LegendMarkerSize | Gets or sets the size of the legend item marker of the series or series point that is currently being painted. Inherited from CustomDrawSeriesEventArgsBase. |
| LegendMarkerVisible | Gets or sets the visibility of the legend item marker of the series or series point that is currently being painted. Inherited from CustomDrawSeriesEventArgsBase. |
| LegendText | Gets or sets the text of the legend item of the series or series point that is currently being painted. Inherited from CustomDrawSeriesEventArgsBase. |
| LegendTextColor | Gets or sets the text color of the legend item of the series or series point that is currently being painted. Inherited from CustomDrawSeriesEventArgsBase. |
| LegendTextVisible | Gets or sets the text visibility of the legend item of the series whose points are currently being drawn. Inherited from CustomDrawSeriesEventArgsBase. |
| Series | Returns the series that is currently being painted. Inherited from CustomDrawSeriesEventArgsBase. |
| SeriesDrawOptions | Returns the draw settings of the series that is currently being drawn. Inherited from CustomDrawSeriesEventArgsBase. |
Remarks
The CustomDrawSeries event is raised before every series is painted. The event parameter’s CustomDrawSeriesEventArgsBase.Series property provides the series which enables the series view and other specific series options to be determined. And the CustomDrawSeriesEventArgsBase.SeriesDrawOptions property provides the drawing options specific to each series. Note that the return value of this property should be typecast to the corresponding type (e.g., BarDrawOptions).
The CustomDrawSeries and ChartControl.CustomDrawSeriesPoint events are always raised in the following order.
- The CustomDrawSeries event for the first series in the chart’s ChartControl.Series collection. The first series in the series collection is a Series which the SeriesCollection.IndexOf method returns 0 for.
- The CustomDrawSeriesPoint event for all the series points of the first series.
- The CustomDrawSeries event for the second series in the chart’s ChartControl.Series collection.
- The CustomDrawSeriesPoint event for all the series points of the second series.
- …and so on for all the other series and their points.
Examples
Create Custom Legend Radio Buttons to Control Visibility of a Chart Series
This example demonstrates how to show chart series (Point, Line, or Area) depending on the selection state of a custom radio button in the chart legend.
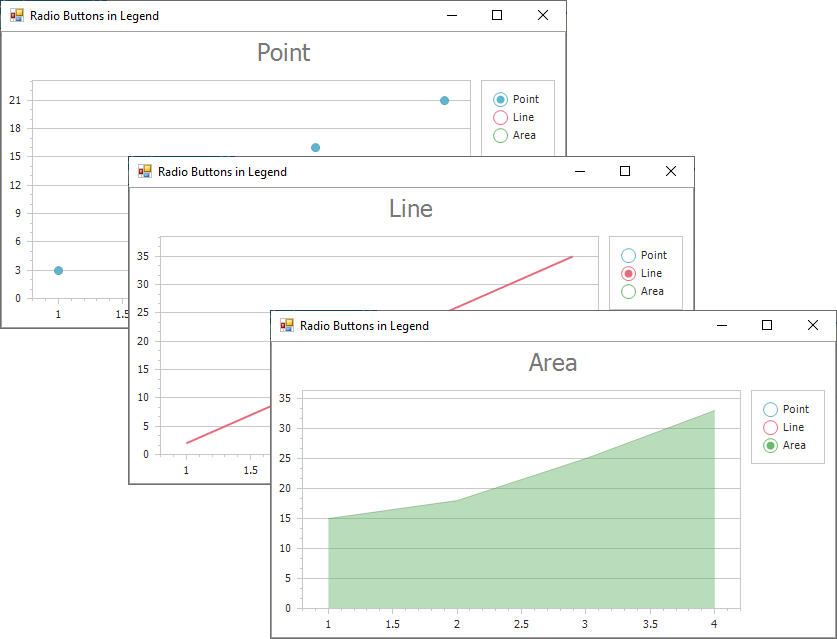
Use the ChartControl.CustomDrawSeries event handler to create a custom appearance for radio buttons based on the color of a selected series. Handle the ChartControl.LegendItemChecked event and use e.CheckedElement and SeriesBase.CheckedInLegend proeprties to show (or hide) the chart series when you switch between radio buttons.
using DevExpress.Drawing;
using DevExpress.XtraCharts;
using System;
using System.Drawing;
using System.Windows.Forms;

namespace CustomCheckboxesInLegendViewAndBehavior {
    public partial class mainForm : Form {
        const int LegendRadioSide = 17;
        const int LegendRadioInnerPointBoundsSide = 8;
        const float LegendRadioWidth = 1.5f;
        bool initializationFlag = false;

        public mainForm() {
            InitializeComponent();
            chartControl.BeginInit(); {
                chartControl.LegendItemChecked += OnLegendItemChecked;
                chartControl.CustomDrawSeries += OnCustomDrawSeries;
                chartControl.Legend.UseCheckBoxes = true;
                chartControl.Series["Point"].CheckedInLegend = false;
                chartControl.Series["Line"].CheckedInLegend = true;
                chartControl.Series["Area"].CheckedInLegend = false;
            }
            chartControl.EndInit();
            initializationFlag = false;
        }

        void OnLegendItemChecked(object sender, LegendItemCheckedEventArgs e) {
            if (initializationFlag == true)
                return;
            initializationFlag = true; {
                Series checkedSeries = e.CheckedElement as Series;
                if (checkedSeries == null)
                    throw new Exception("Expected series only");
                foreach (Series series in chartControl.Series)
                    series.CheckedInLegend = false;
                checkedSeries.CheckedInLegend = true;
                chartControl.Titles[0].Text = checkedSeries.Name;
            }
            initializationFlag = false;
        }

        void OnCustomDrawSeries(object sender, CustomDrawSeriesEventArgs e) {
            DXBitmap bitmap = new DXBitmap(LegendRadioSide, LegendRadioSide);
            using (DXGraphics graphics = DXGraphics.FromImage(bitmap)) {
                graphics.SmoothingMode = DXSmoothingMode.HighQuality;
                Color seriesColor = GetSeriesColor(e.Series, chartControl);
                using (DXPen radioPen = new DXPen(seriesColor, LegendRadioWidth)) {
                    int radioRadius = LegendRadioSide - 3;
                    Rectangle radioRectangle = new Rectangle(1, 1, radioRadius, radioRadius);
                    graphics.DrawEllipse(radioPen, radioRectangle);
                }
                if (e.Series.CheckedInLegend) {
                    using (DXBrush brush = new DXSolidBrush(seriesColor)) {
                        int coord = (LegendRadioSide - LegendRadioInnerPointBoundsSide) / 2;
                        Rectangle filledEllipseBounds = new Rectangle(coord, coord,
                              LegendRadioInnerPointBoundsSide, LegendRadioInnerPointBoundsSide);
                        graphics.FillEllipse(brush, filledEllipseBounds);
                    }
                }
            }
            e.DisposeLegendMarkerImage = true;
            e.DXLegendMarkerImage = bitmap;
        }

        Color GetSeriesColor(Series series, ChartControl chartControl) {
            int seriesIndex = chartControl.Series.IndexOf(series);
            string paletteName = chartControl.PaletteName;
            Palette currentPalette = chartControl.PaletteRepository[paletteName];
            PaletteEntry paletteEntryAccordingToSeries = currentPalette[seriesIndex];
            Color result = paletteEntryAccordingToSeries.Color;
            return result;
        }
    }
}
Draw a Custom Legend Marker for a Series
This example demonstrates how to use the ChartControl.CustomDrawSeries event to modify the legend markers of bar series.
Assign a custom legend marker to the e.DXLegendMarkerImage property. Set the e.DisposeLegendMarkerImage property to true to avoid memory leaks. To customize options used to draw the series, cast e.SeriesDrawOptions to the DrawOptions class descendant that stores draw options of the required series view type.
using CustomDrawingSample.Model;
using DevExpress.Drawing;
using DevExpress.XtraCharts;
using System;
using System.Collections.Generic;
using System.Drawing;
using System.Drawing.Drawing2D;
using System.IO;
using System.Linq;

namespace CustomDrawingSample {
    public partial class Form1 : DevExpress.XtraEditors.XtraForm {
        string trackedSeriesName;
        Dictionary<string, DXImage> photoCache = new Dictionary<string, DXImage>();

        #region #Constants
        const int borderSize = 5;
        const int scaledPhotoWidth = 48;
        const int scaledPhotoHeight = 51;
        // Width and height of scaled photo with border.
        const int totalWidth = 58;
        const int totalHeight = 61;

        // Rects required to create a custom legend series marker.
        static readonly Rectangle photoRect = new Rectangle(
                borderSize, borderSize,
                scaledPhotoWidth, scaledPhotoHeight);
        static readonly Rectangle totalRect = new Rectangle(
                0, 0,
                totalWidth, totalHeight);
        #endregion

        public Form1() {
            InitializeComponent();
        }

        private void Form1_Load(object sender, EventArgs e) {
            using (var context = new NwindDbContext()) {
                InitPhotoCache(context.Employees);
                chart.DataSource = context.Orders.ToList();
            }

            chart.SeriesDataMember = "Employee.FullName";
            chart.SeriesTemplate.ArgumentDataMember = "OrderDate";
            chart.SeriesTemplate.ValueDataMembers.AddRange("Freight");

            XYDiagram diagram = chart.Diagram as XYDiagram;
            if (diagram != null) {
                diagram.AxisX.DateTimeScaleOptions.AggregateFunction = AggregateFunction.Sum;
                diagram.AxisX.DateTimeScaleOptions.MeasureUnit = DateTimeMeasureUnit.Year;
            }

            chart.CustomDrawSeries += OnCustomDrawSeries;
            chart.ObjectHotTracked += OnObjectHotTracked;
        }

        private void OnObjectHotTracked(object sender, HotTrackEventArgs e) {
            trackedSeriesName = e.HitInfo.InSeries ? ((Series)e.HitInfo.Series).Name : null;
        }

        void InitPhotoCache(IEnumerable<Employee> employees) {
            photoCache.Clear();
            foreach (var employee in employees) {
                using (MemoryStream stream = new MemoryStream(employee.Photo)) {
                    if (!photoCache.ContainsKey(employee.FullName))
                        photoCache.Add(employee.FullName, DXImage.FromStream(stream));
                }
            }
        }

        #region #CustomDrawSeriesImplementation
        private void OnCustomDrawSeries(object sender, CustomDrawSeriesEventArgs e) {
            bool isSelected = e.Series.Name.Equals(trackedSeriesName);
            // Design a series marker image.
            DXBitmap image = new DXBitmap(totalWidth, totalHeight);
            using (DXGraphics graphics = DXGraphics.FromImage(image)) {
                using (var fillBrush = isSelected ? (DXBrush)new DXHatchBrush(DXHatchStyle.DarkDownwardDiagonal,
                                                                          e.LegendDrawOptions.Color,
                                                                          e.LegendDrawOptions.ActualColor2)
                                                  : (DXBrush)new DXSolidBrush(e.LegendDrawOptions.Color)) {
                    graphics.FillRectangle(fillBrush, totalRect);
                }
                DXImage photo;
                if (photoCache.TryGetValue(e.Series.Name, out photo))
                    graphics.DrawImage(photo, photoRect);
            }
            e.DXLegendMarkerImage = image;
            e.DisposeLegendMarkerImage = true;

            BarDrawOptions options = e.SeriesDrawOptions as BarDrawOptions;
            if (options != null && isSelected) {
                options.FillStyle.FillMode = DevExpress.XtraCharts.FillMode.Hatch;
                ((HatchFillOptions)options.FillStyle.Options).HatchStyle = HatchStyle.DarkDownwardDiagonal;
            }
        }
        #endregion
    }
}
Related GitHub Examples
The following code snippets (auto-collected from DevExpress Examples) contain references to the CustomDrawSeries event.
Note
The algorithm used to collect these code examples remains a work in progress. Accordingly, the links and snippets below may produce inaccurate results. If you encounter an issue with code examples below, please use the feedback form on this page to report the issue.