ChartControl.AutoLayout Property
Gets or sets a value, which specifies whether the adaptive layout feature is enabled for chart elements in the chart control.
Namespace: DevExpress.XtraCharts
Assembly: DevExpress.XtraCharts.v20.2.UI.dll
NuGet Package: DevExpress.Win.Charts
Declaration
Property Value
| Type | Description |
|---|---|
| Boolean | true, to apply the adaptive layout algorithm to the chart; otherwise, false. |
Remarks
The adaptive layout feature is used to maintain a better chart appearance and layout when the chart becomes smaller.
To accomplish this task, the chart elements that have a Visibility property (e.g., a legend (Legend.Visibility), an axis (Axis2D.Visibility), an axis title (AxisTitle.Visibility) or a chart title (DockableTitle.Visibility)) are hidden.
Elements are hidden in the following order:
In addition, the label position inside bars can be changed for those labels for which the BarSeriesLabel.Position property is set to BarSeriesLabelPosition.Auto mode (the default value).
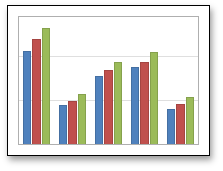
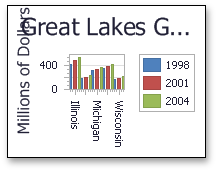
The following images demonstrate the AutoLayout property in action for SideBySideBarSeriesView.
| AutoLayout =true (the default value) | AutoLayout = false |
|---|---|
 |
 |
In the case of pie and donut charts, the Dimension property for SimpleDiagram and SimpleDiagram3D is calculated automatically during resizing. For instance, when you decrease chart size, all pies (donuts) are placed in one line horizontally (by row) or vertically (by column) in the diagram to occupy all the available free space.
Example
The following code disables AutoLayout: