Range Area Chart
- 4 minutes to read
Short Description
The Range Area chart is represented by the RangeAreaSeriesView object, which belongs to Area Series Views. This view displays series as filled areas on a diagram, with two data points that define minimum and maximum limits. This view is useful when you need to illustrate the difference between start and end values.
A Range Area chart is shown in the image below. Note that this chart type is based upon the XYDiagram, so it can be rotated to show areas either vertically or horizontally.
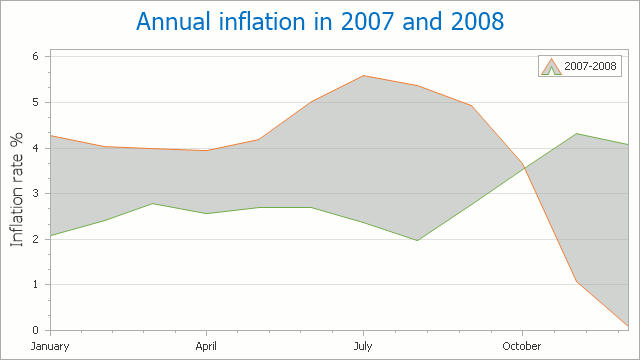
Chart Type Characteristics
The table below lists the main characteristics of this chart type.
| Feature | Value |
|---|---|
| Series View type | RangeAreaSeriesView |
| Diagram type | 2D-XYDiagram |
| Number of arguments per series point | 1 |
| Number of values per series point | 2 |
Note
For information on which chart types can be combined with the Range Area Chart, refer to the Series Views Compatibility document.
Example
The following example demonstrates how to create a ChartControl with a series of the RangeAreaSeriesView type, and add this chart to a form at runtime. Before proceeding with this example, first create a Windows Forms Application in Visual Studio, and include all necessary assemblies to the References list of your project.
Then, add the following code to the Form.Load event handler.
using System;
using System.Windows.Forms;
using DevExpress.XtraCharts;

namespace RangeAreaChart {
    public partial class Form1 : Form {
        public Form1() {
            InitializeComponent();
        }

        private void Form1_Load(object sender, System.EventArgs e) {
            // Create a new chart.
            ChartControl rangeAreaChart = new ChartControl();

            // Create a range area series.
            Series series1 = new Series("Series 1", ViewType.RangeArea);

            // Add points to them.
            series1.Points.Add(new SeriesPoint(new DateTime(2008, 1, 1), 2.08, 4.28));
            series1.Points.Add(new SeriesPoint(new DateTime(2008, 1, 2), 2.42, 4.03));
            series1.Points.Add(new SeriesPoint(new DateTime(2008, 1, 3), 2.78, 3.98));
            series1.Points.Add(new SeriesPoint(new DateTime(2008, 1, 4), 2.57, 3.94));
            series1.Points.Add(new SeriesPoint(new DateTime(2008, 1, 5), 2.69, 4.18));
            series1.Points.Add(new SeriesPoint(new DateTime(2008, 1, 6), 2.69, 5.02));
            series1.Points.Add(new SeriesPoint(new DateTime(2008, 1, 7), 2.36, 5.60));
            series1.Points.Add(new SeriesPoint(new DateTime(2008, 1, 8), 1.97, 5.37));
            series1.Points.Add(new SeriesPoint(new DateTime(2008, 1, 9), 2.76, 4.94));
            series1.Points.Add(new SeriesPoint(new DateTime(2008, 1, 10), 3.54, 3.66));
            series1.Points.Add(new SeriesPoint(new DateTime(2008, 1, 11), 4.31, 1.07));
            series1.Points.Add(new SeriesPoint(new DateTime(2008, 1, 12), 4.08, 0.09));

            // Add a series to the chart.
            rangeAreaChart.Series.Add(series1);

            // Access the view-type-specific options of the series.
            ((RangeAreaSeriesView)series1.View).Transparency = 80;

            // Access the type-specific options of the diagram.
            ((XYDiagram)rangeAreaChart.Diagram).AxisX.GridLines.Visible = true;
            ((XYDiagram)rangeAreaChart.Diagram).AxisY.WholeRange.MinValue = -0.5;
            ((XYDiagram)rangeAreaChart.Diagram).AxisY.WholeRange.MaxValue = 6;

            // Hide the legend (if necessary).
            rangeAreaChart.Legend.Visible = false;

            // Add a title to the chart (if necessary).
            rangeAreaChart.Titles.Add(new ChartTitle());
            rangeAreaChart.Titles[0].Text = "A Range Area Chart";

            // Add the chart to the form.
            rangeAreaChart.Dock = DockStyle.Fill;
            this.Controls.Add(rangeAreaChart);
        }
    }
}