Advanced Charting
- 3 minutes to read
This document lists advanced features that will provide a professional look to a complex chart.
Complex Data Representation
The XY-diagram supports an unlimited number of additional panes and secondary axes, which makes it possible to effectively represent complex and diverse data structures onto your chart.
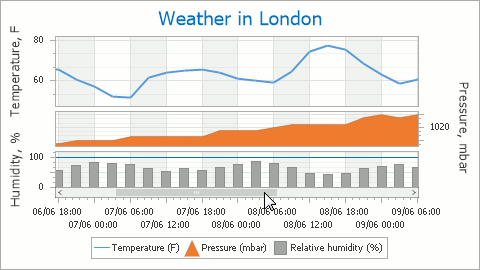
With independent scrolling and zooming for different panes and axes, you are not limited by the quantity of data that can be fed at a time.
In addition, you can use the crosshair cursor interaction tool that allows you to track series point coordinates on a chart and analyze data by comparing different graphs. For more information, see the Tooltip and Crosshair Cursor topic.
Flexible Axis Scale
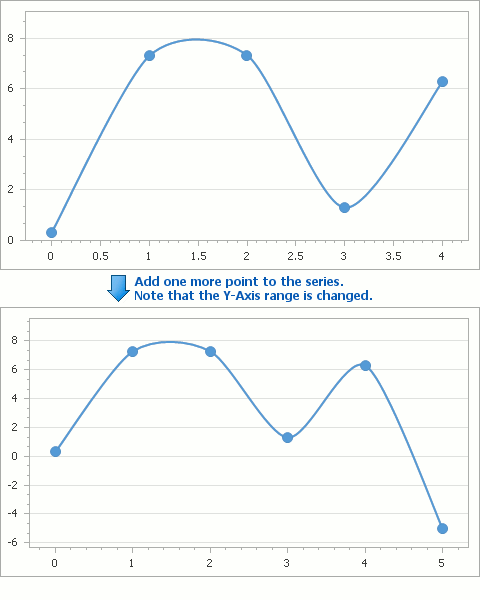
Automatic and Manual Scale Ranges
The WinForms Chart Control analyzes incoming data and automatically adjusts the range of its axes to fit all series points. You can limit or extend an axis range on your own, as well as make the axis scrollable.
Smart Date-Time Scale
When a series uses the date-time argument scale type, you can use the advantages of the automatic date-time modes. To learn more about them, see Data Aggregation.
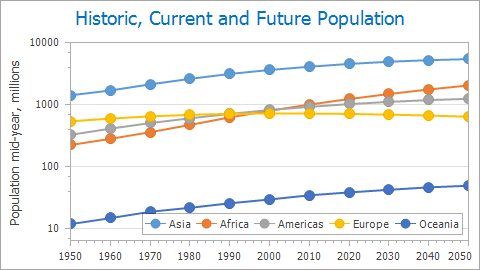
Logarithmic Scale
For numeric data, you can enable the AxisBase.Logarithmic property of an axis.
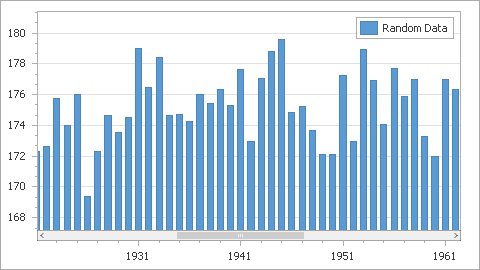
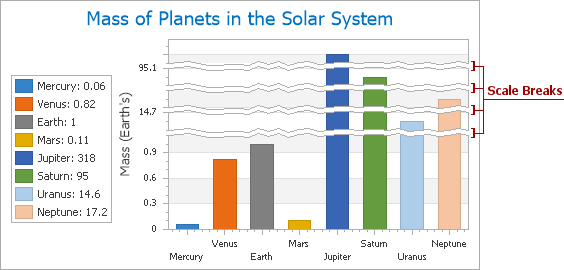
Automatic and Manual Scale Breaks
When the AutoScaleBreaks.Enabled property is turned on, the chart control automatically inserts scale breaks (up to the specified number) into an axis range if this is suggested by incoming data.
Alternatively, you can insert any number of custom scale breaks to avoid a pointless use of the chart’s area by an unnecessary or non-relevant data.
Comprehensive Explanatory Capabilities
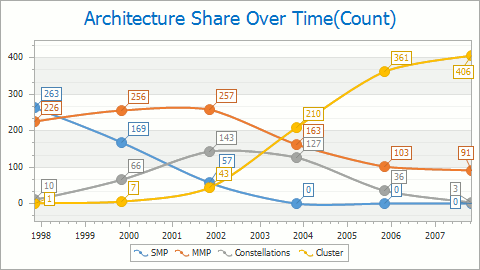
Smart Series Point Labels
The WinForms Chart Control effectively solves the all-common problem of charting - a mess that occurs when a lot of series data points are displayed, each accompanied with its own label. To avoid such mess in your chart, you can choose among several algorithms to find the one that best suits your needs. For details, see Series Point Labels.
Interactive Text and Image Annotations
You can accompany your chart with any number of text or image annotations that can be anchored to any point on a chart’s surface or any diagram coordinate or a series point.
Moreover, you can provide your end-users with the capability to re-locate, rotate, re-size, and anchor annotations by themselves.
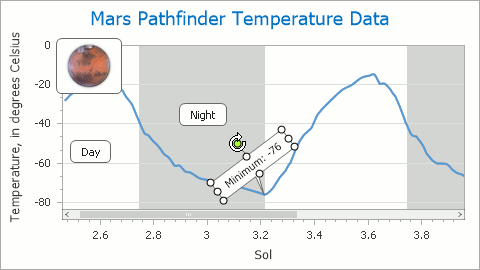
Chart Titles
You can create an unlimited number of chart titles with HTML and word-wrap support, and position them freely onto your chart.

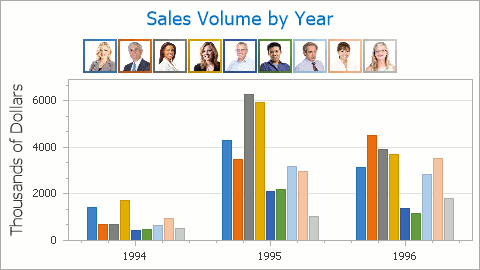
Enhanced Legend Capabilities
Using special event handlers, you can fully customize the appearance and layout of the legend items, i.e. change their marker appearance (their colors, fill style, size and visibility) and adjust their text options (font, color and visibility).
Moreover, you can specify custom images for the legend item markers.