Financial Charting
- 4 minutes to read
The Chart Control for WinForms provides a set of built-in features to display financial data.
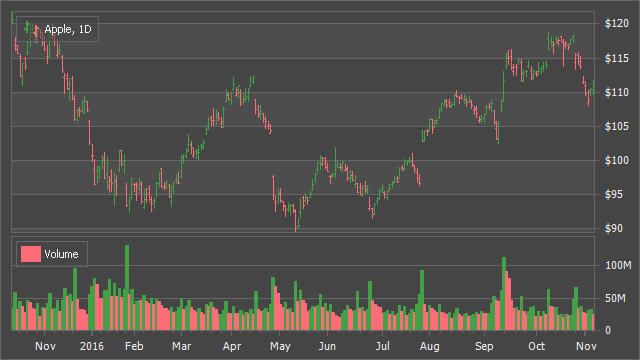
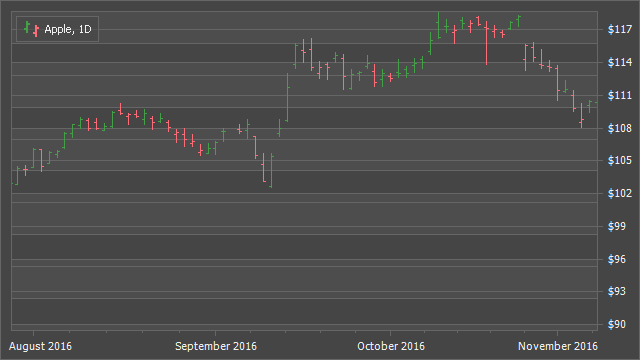 Stock Series View 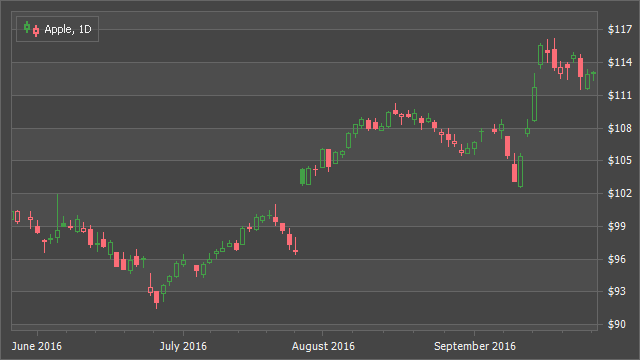 Candle Stick Series View | The Chart Control supports special series views for financial charting. These series views are also known as Open-High-Low-Close (OHLC) series view.
Note that you can combine OHLC series views with other compatible series views in one XY-Diagram. Refer to the Financial Series Views to learn more about OHLC series views. |
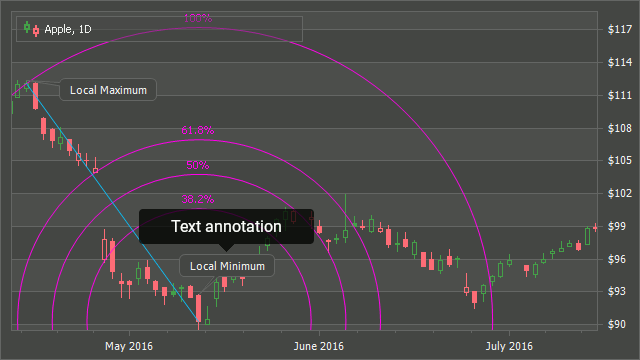
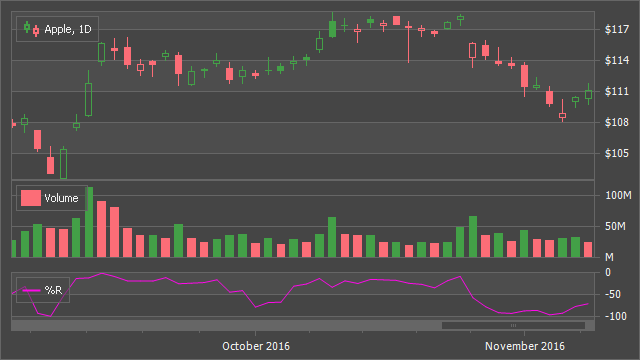
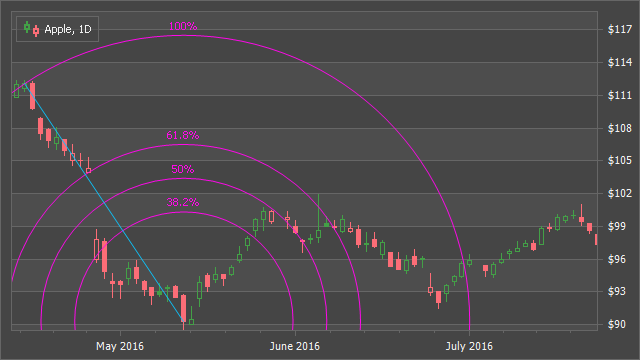 Fibonacci Arcs 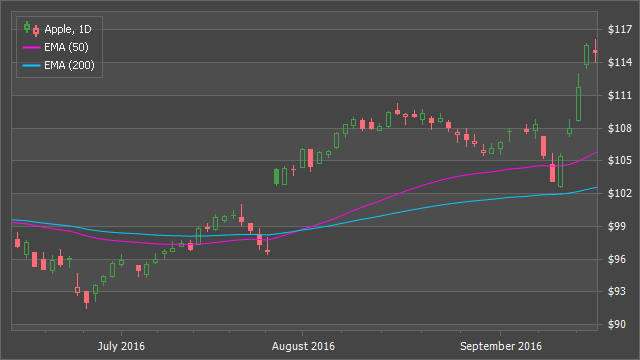 Moving Averages 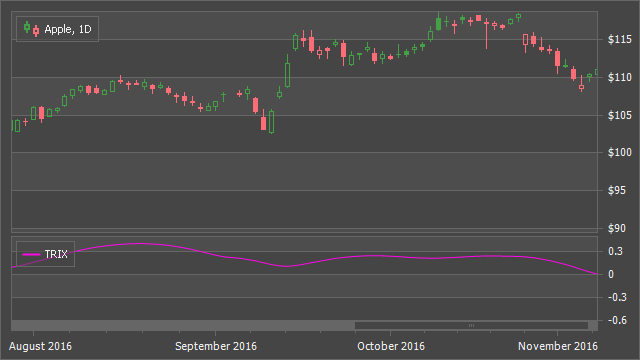 Triple Exponential Moving Average (TRIX) | Technical indicators display point sets calculated using specific formulas by series’ point values. They allow end users to analyze historical data and predict future price changes. The Chart Control supports the following groups of indicators required for technical analysis.
Refer to Indicators for the complete list of indicators that the Chart Control supports. |
| Annotations allow you to display a “callout” with text or an image above a chart. You can attach an annotation to an individual series point, to a given diagram’s coordinate, or to a chart control’s point. A user can move or rotate the callout body at runtime if the runtime edit is enabled. Refer to the Annotations topic for more information. |
| The lazy update system, data aggregation, summary functions, and hardware-accelerated rendering allow the Chart Control to process tens of thousands of financial series points in real time. The lazy update system changes the internal chart model only when the Chart control should render its content. It helps the control avoid unnecessary calculations. The Summary Functions and Data Aggregation allow you to reduce the number of series points that the chart control displays. These features reduce the number of data points that the control displays and spares end users from data mess on the chart. DirectX Hardware Acceleration allows the control to draw its content faster using a client device’s video card (integrated or dedicated). Refer to the Performance guide to learn how to enhance the performance of your applications that utilize the Chart Control. |
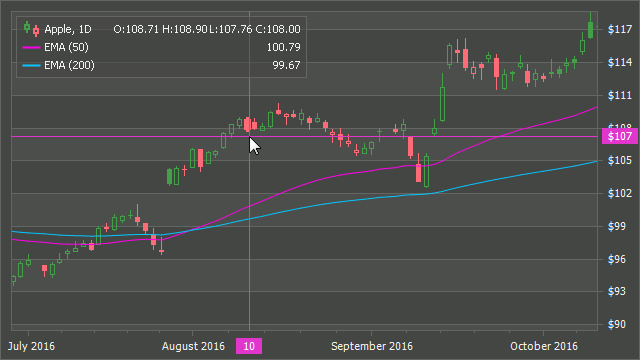
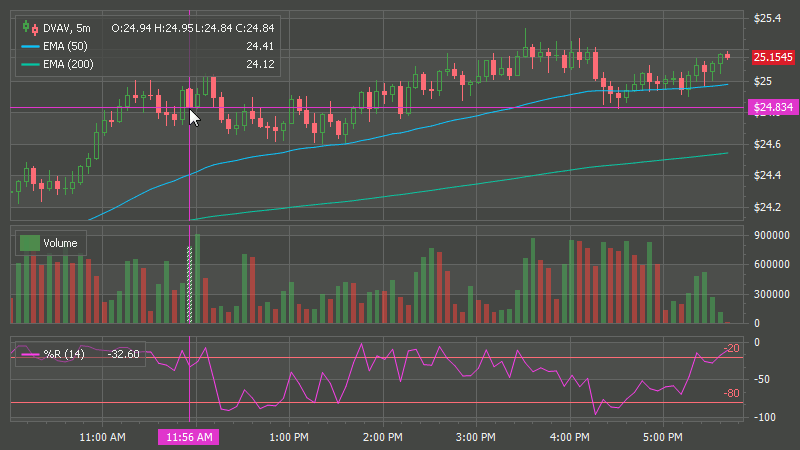
| The Crosshair Cursor is a powerful tool that displays series and indicator values in a popup window over the chart control’s content. The Crosshair allows end-users to track price and indicator value changes. Tip Set the CrosshairEnabled property to DefaultBoolean.True to display the indicator in the Crosshair Cursor. Refer to the Crosshair Cursor guide for more information about the Crosshair Cursor. |
Advanced Chart Layout | |
| The Chart Control provides advanced capabilities of data representation using highly customizable chart elements.
|