Pivot Charting (Integration with a Pivot Grid Control)
- 6 minutes to read
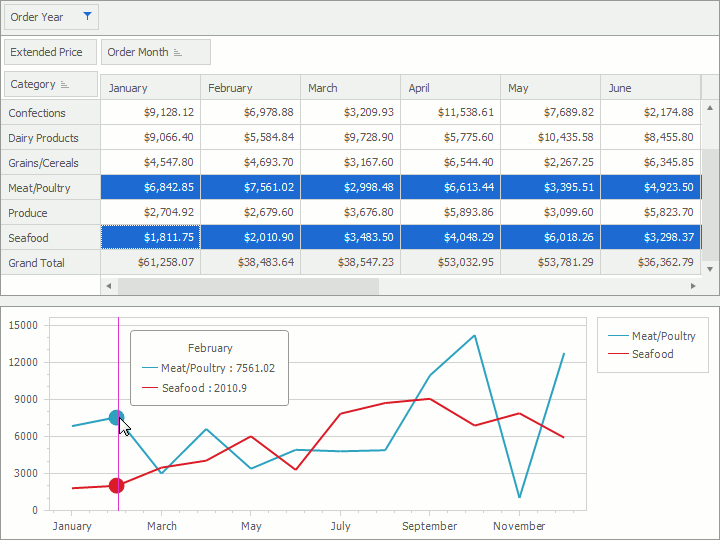
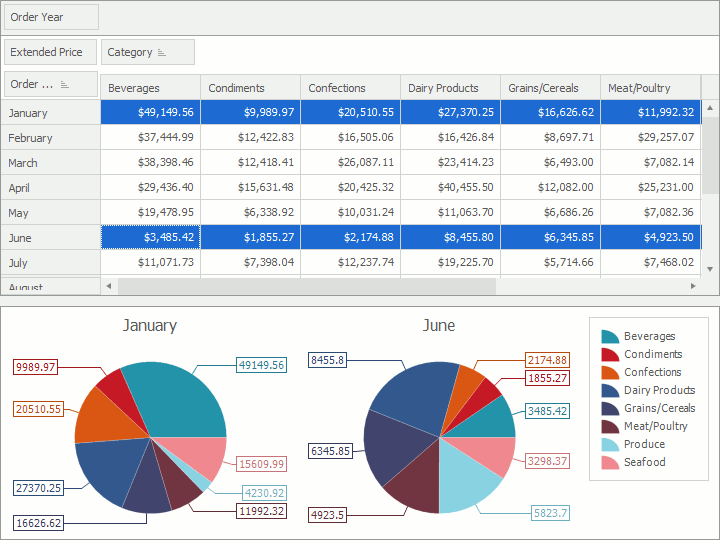
The ChartControl can load and visualize data directly from the PivotGridControl control. Each control provides a specific option set that configures how Chart Control displays shared data. This guide explains how to configure the Pivot Charting bundle containing the Pivot Grid control and the Chart Control using the Chart’s options.
Note
Similar functionality is available for bridging the XRChart and XRPivotGrid.
This guide contains the following sections:
Pivot Grid Data Providing
A Chart Control retrieves a Pivot Grid‘s data after assigning a PivotGridControl to the ChartControl‘s ChartControl.DataSource property using one of the following ways:
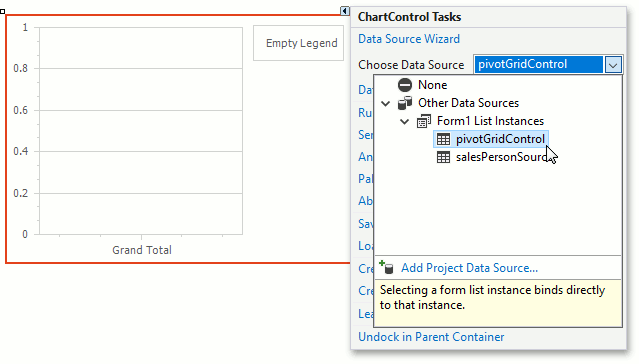
At design time: click the Chart Control, click its Smart Tag and select a Pivot Grid instance in the Choose Data Source field.
At runtime: the following code demonstrates how to use a Pivot Grid as a Chart’s data source.
The Pivot Grid control automatically provides all the required data member names for series generation. Refer to the Automatic Settings section to learn more.
The ChartControl.PivotGridDataSourceOptions property configures how the Chart retrieves a Pivot Grid’s data. At the same time, the PivotGridControl.OptionsChartDataSource property configures how the Pivot Grid provides its data to a chart. These properties specify options that are shared between the Chart and Pivot Grid. The table below contains the Chart’s and Pivot Grid’s settings that configure the same functionality and their descriptions.
| Chart setting | Pivot Grid setting | Description |
|---|---|---|
| Auto-initialization | ||
| PivotGridDataSourceOptions.AutoBindingSettingsEnabled | Specifies whether the chart’s data binding is automatically adjusted during Pivot Chart creation. | |
| PivotGridDataSourceOptions.AutoLayoutSettingsEnabled | Specifies whether the chart’s layout is automatically adjusted during Pivot Chart creation. | |
| Format of the incoming data | ||
| PivotGridDataSourceOptions.RetrieveDataByColumns | PivotGridOptionsChartDataSourceBase.ProvideDataByColumns | Specifies whether a Chart’s series are created based on its associated Pivot Grid’s columns or rows. |
| PivotGridDataSourceOptions.RetrieveEmptyCells | PivotGridOptionsChartDataSourceBase.ProvideEmptyCells | Specifies whether empty cells should be passed to a Chart from its associated Pivot Grid. |
| Treatment of pivot totals | ||
| PivotGridDataSourceOptions.RetrieveColumnCustomTotals | PivotGridOptionsChartDataSourceBase.ProvideColumnCustomTotals | Specifies whether column custom totals should be passed to a Chart from its associated Pivot Grid. |
| PivotGridDataSourceOptions.RetrieveColumnGrandTotals | PivotGridOptionsChartDataSourceBase.ProvideColumnGrandTotals | Specifies whether column grand totals should be passed to a Chart from its associated Pivot Grid. |
| PivotGridDataSourceOptions.RetrieveColumnTotals | PivotGridOptionsChartDataSourceBase.ProvideColumnTotals | Specifies whether column totals should be passed to a Chart from its associated Pivot Grid. |
| PivotGridDataSourceOptions.RetrieveRowCustomTotals | PivotGridOptionsChartDataSourceBase.ProvideRowCustomTotals | Specifies whether row custom totals should be passed to a Chart from its associated Pivot Grid. |
| PivotGridDataSourceOptions.RetrieveRowGrandTotals | PivotGridOptionsChartDataSourceBase.ProvideRowGrandTotals | Specifies whether row grand totals should be passed to a Chart from its associated Pivot Grid. |
| PivotGridDataSourceOptions.RetrieveRowTotals | PivotGridOptionsChartDataSourceBase.ProvideRowTotals | Specifies whether row totals should be passed to a Chart from its associated Pivot Grid. |
| Limiting the number of series and points | ||
| PivotGridDataSourceOptions.MaxAllowedPointCountInSeries | PivotGridOptionsChartDataSourceBase.MaxAllowedPointCountInSeries | Limits the number of points in a Chart’s auto-created series that are based on the associated Pivot Grid’s data. |
| PivotGridDataSourceOptions.MaxAllowedSeriesCount | PivotGridOptionsChartDataSourceBase.MaxAllowedSeriesCount | Limits the number auto-created series that are based on the associated Pivot Grid’s data. |
| Additional option | ||
| PivotGridDataSourceOptions.SelectionOnly | PivotGridOptionsChartDataSource.SelectionOnly | Specifies whether a Chart display selected cells only or all the Pivot Grid’s data. |
| PivotGridDataSourceOptions.UpdateDelay | PivotGridOptionsChartDataSource.UpdateDelay | Specifies the delay between when the Pivot Grid’s cell focuses, or selection changes, and when the Chart’s data updates. |
Note
The PivotGridDataSourceOptions.MaxAllowedSeriesCount and PivotGridDataSourceOptions.MaxAllowedPointCountInSeries properties’ default values limit series’ and series points’ count. Set these properties to 0 to remove the limit.
The Automatic Settings
Automatic Binding Settings
The PivotGridDataSourceOptions.AutoBindingSettingsEnabled property configures whether the Chart automatically obtains data member names and a value scale type from the Pivot Grid.
The Pivot Grid provides the data member names to the Chart in the following manner if ChartControl.PivotGridDataSourceOptions‘s PivotGridDataSourceOptions.RetrieveDataByColumns property is set to true:
- The name of the data member that specifies Pivot Grid’s columns to the Chart’s ChartControl.SeriesDataMember property.
- The name of the data member that specifies Pivot Grid’s rows to the Chart’s series template’s SeriesBase.ArgumentDataMember property.
- The name of summarized values to the Chart’s series template’s SeriesBase.ValueDataMembers property.
Otherwise:
- The name of the data member that specifies Pivot Grid’s rows to the Chart’s ChartControl.SeriesDataMember property.
- The name of the data member that specifies Pivot Grid’s columns to the Chart’s series template’s SeriesBase.ArgumentDataMember property.
- The name of summarized values to the Chart’s series template’s SeriesBase.ValueDataMembers property.
Handle the ChartControl.CustomizeAutoBindingSettings event that the Chart raises after it obtains data member names to modify these settings.
Note that if multiple fields identify a column/row, the respective field values connected by the ‘|’ sign construct the corresponding data member value (for example, ‘1995 | January’).
Automatic Layout Settings
The ChartControl.AutoLayoutSettingsEnabled property automatically adjusts the chart’s layout for two main diagram types:
-
If the argument scale type is date-time, the X-axis’s DateTimeScaleOptions.MeasureUnit and DateTimeScaleOptions.GridAlignment properties are set to data points’ minimum measurement unit.
Similar to these settings, the DateTimeOptions.Format and DateTimeOptions.FormatString values depend on the assigned measurement unit.
If arguments have different date time measurement units (for example, years and months), the Chart automatically inserts scale breaks (when the ScaleBreakOptions.Style is set to Straight, and ScaleBreakOptions.SizeInPixels to -1) into the X-axis’ range. This hides the space between data points (for example, a yearly point in a monthly scale has 11 empty months before the next point appears, and a scale break would hide this space).
Note that the specified measurement unit affects X-axis labels‘ text. The AxisLabel.Staggered property is enabled, and the AxisLabel.Angle property is set to 0 by default.
The Chart raises the ChartControl.BoundDataChanged event after applying these settings.
-
The legend is visible if the chart has a single auto-created series, or the number of points in all auto-created series is equal, and one or more series contain all (not empty) points from another series (only this series appears in the legend). The auto-created series’s SeriesBase.LegendTextPattern property is set to the “{A}” pattern.
If the legend is visible, then each auto-created series’ SeriesLabelBase.TextPattern property value is “{V}” or “{A} {V}” and the Pie and Doughnut series’s PieSeriesLabel.Position is set to TwoColumns.
Series titles accompany each auto-created series. The Title.Text property is set to the series name.
The Chart raises the ChartControl.CustomizeXAxisLabels event after applying these settings.
The series labels‘ SeriesLabelBase.ResolveOverlappingMode is set to Default by default and changes to HideOverlappedif the label count is too large for the current diagram. The Chart raises the ChartControl.CustomizeResolveOverlappingMode event before this property updates.
Finally, the chart legend’s Legend.MaxHorizontalPercentage and the Legend.MaxVerticalPercentage properties are automatically adjusted for the best legend and diagram size ratio. The Chart raises the ChartControl.CustomizeLegend event before updating the above properties.