Key Performance Indicators (KPIs)
- 5 minutes to read
In Analysis Services, a KPI is a collection of calculations associated with a measure group in a cube used to evaluate business success. A typical KPI consists of the actual value achieved, the goal, status, trend and weight values. To learn more about KPIs, see the Key Performance Indicators topic in MSDN.
Displaying KPI Values
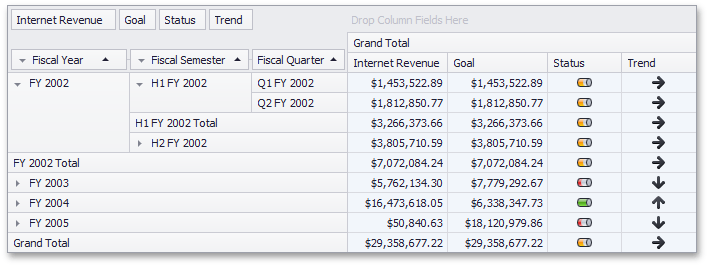
If an OLAP cube contains KPI (key performance indicator) information, the PivotGridControl can automatically recognize it and display it in an appropriate format. A typical KPI consists of the actual value achieved, the goal, status, trend and weight values. Use the PivotGridControl.GetOLAPKPIList method to obtain a list of KPI names provided by the OLAP cube.
In the OLAP cube, a KPI’s value is represented by a measure to which a Pivot Grid Control field should be bound to display the KPI value. The PivotGridControl.GetOLAPKPIMeasures method returns measures used to calculate the value, goal, status, trend and weight that represent the values of the specified KPI. The actual KPI values can be obtained using the PivotGridControl.GetOLAPKPIValue method.
You can obtain the type of the measure for a specified field using the PivotGridFieldBase.KPIType property. This property returns a PivotKPIType object that enumerates measure types (i.e., value, goal, status, trend and weight).
Tip
Demo: Code Examples - OLAP - OLAP KPI module in the XtraPivotGrid MainDemo
Requires installation of WinForms Subscription. Download.
Managing KPI Graphics
The Status and Trend measures contained in an OLAP cube can be visualized using server-defined graphics or specific custom graphics.
A graphic set consists of three images, each corresponding to a progress state. For instance, the cylinder graphics provide the  ,
,  and
and  images for the good, bad and neutral states, respectively. To obtain a graphic set defined on the server for the specified KPI’s, use the PivotGridControl.GetOLAPKPIServerGraphic method.
To visualize KPI values using custom graphics for the required Status or Trend fields, set the PivotGridFieldBase.KPIGraphic property. The values listed by PivotKPIGraphic enumeration are used to set this property’s value.
To obtain an image that corresponds to the specified KPI value (-1, 0, 1), use the PivotGridControl.GetKPIBitmap method.
Regular Data Sources
KPI values can be visualized for a regular data source as well. To do this, create an unbound field containing only values corresponding to the good (1), bad (-1) and neutral (0) states. To provide unbound columns with these values, use an unbound expression and assign this expression to the GridViewDataColumn.UnboundExpression property. To visualize unbound field values with images, use the PivotGridFieldBase.KPIGraphic property.
Example
The following example shows how to display KPI graphics in a PivotGridControl bound to a regular data source.
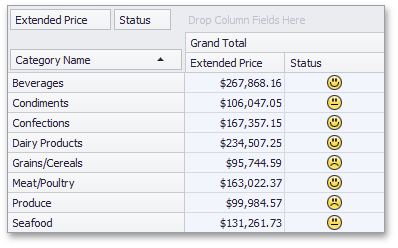
The Pivot Grid Control is bound to the “Sales Person” view in the Northwind database. To display KPI graphics, we create an unbound field whose values correspond to images contained within a KPI graphic set.
In this example, the unbound field values depend on the “Extended Price” field values: if the “Extended Price” field value is less than 100,000, the unbound field value is “-1”, if the “Extended Price” field value is less than 150,000, the unbound field value is “0”. In other cases, the unbound field value is “1”.
The PivotGridOptionsData.DataFieldUnboundExpressionMode property is set to DataFieldUnboundExpressionMode.UseSummaryValues to calculate unbound expressions for data fields against summary values. The PivotGridFieldBase.KPIGraphic property specifies a graphic set used to visualize unbound field values.
The following image shows the result of the KPI values visualization:
using System;
using System.Windows.Forms;
using DevExpress.XtraPivotGrid;

namespace WindowsFormsApp_RegularDataSourceKPI
{
    public partial class Form1 : Form
    {
        public Form1()
        {
            InitializeComponent();
        }

        private void Form1_Load(object sender, EventArgs e)
        {
            // Binds the pivot grid to data.
            this.salesPersonTableAdapter.Fill(this.nwindDataSet.SalesPerson);

            // Specifies that unbound expressions for data fields are calculated against summary values.
            pivotGridControl1.OptionsData.DataFieldUnboundExpressionMode =
                DataFieldUnboundExpressionMode.UseSummaryValues;

            // Creates a new unbound "Status" field to show KPI values.
            PivotGridField unboundField = pivotGridControl1.Fields.Add("Status", PivotArea.DataArea);

            // Sets a column's unbound type and specifies an unbound expression.
            unboundField.UnboundType = DevExpress.Data.UnboundColumnType.Integer;
            unboundField.UnboundExpression =
                string.Format("(Iif([{0}]<100000,-1,Iif([{0}]<150000,0,1)))",
                fieldExtendedPrice1.ExpressionFieldName);

            // Sets the Data Header Area within which the "Status" Field can be positioned.
            unboundField.AllowedAreas = DevExpress.XtraPivotGrid.PivotGridAllowedAreas.DataArea;

            // Specifies a graphic set used to indicate KPI values.
            unboundField.KPIGraphic = PivotKPIGraphic.Faces;

        }
    }
}