Side-by-Side Stacked Bar Chart
- 5 minutes to read
Short Description
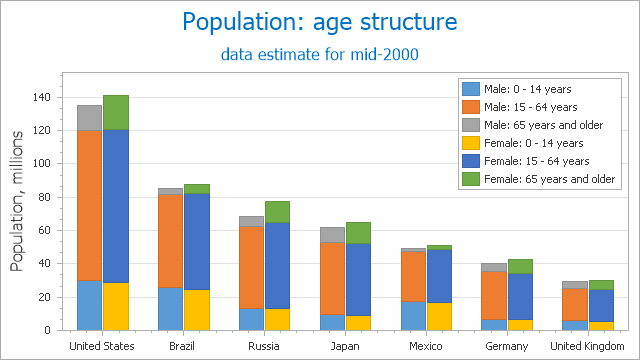
The Side-by-Side Stacked Bar Chart is represented by the SideBySideStackedBarSeriesView object, which belongs to Bar Series Views. This view combines the advantages of both the Stacked Bar and Side-by-Side Bar chart types, so that you can stack different bars, and combine them into groups shown side-by-side across the same axis value (via the SideBySideStackedBarSeriesView.StackedGroup property).
Note
When using series template binding for Side-by-Side Stacked Bars, the SideBySideStackedBarSeriesView.StackedGroup property should be specified at runtime, in the ChartControl.BoundDataChanged event handler.
A Side-by-Side Stacked Bar chart is shown in the image below. Note that this chart type is based upon the XYDiagram, so it can be rotated to show bars either vertically or horizontally.
Note
A Side-by-Side Stacked Bar chart can display series containing data points with positive or negative values. However, a series with positive values is stacked only with other series containing positive values; and a series with negative values is stacked with other series containing negative values.
Note that if a series contains data points with both positive and negative values, it is treated as a series with positive values, while all its negative values are treated as zeros.
Chart Type Characteristics
The table below lists the main characteristics of this chart type.
| Feature | Value |
|---|---|
| Series View type | SideBySideStackedBarSeriesView |
| Diagram type | 2D-XYDiagram |
| Number of arguments per series point | 1 |
| Number of values per series point | 1 |
Note
For information on which chart types can be combined with the Side-by-Side Stacked Bar Chart, refer to the Series Views Compatibility document.
Example
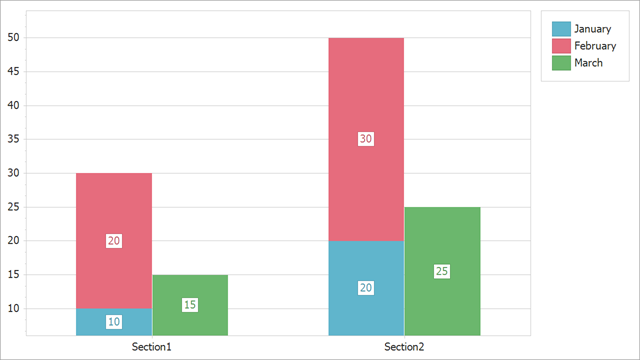
The following example creates a ChartControl and generates multiple SideBySideStackedBarSeriesView type series based on a template at runtime. For more information on how to create a chart at runtime, refer to the following topic: How to: Add a Chart to a Windows Forms Application.
To create multiple series based on a template, specify the following SeriesTemplate properties:
- SeriesDataMember – Specifies the data member that stores series names.
- ArgumentDataMember – Specifies the data member that stores series point arguments.
- ValueDataMembers – Specifies the data member that stores series point values.
To specify a group to which a stacked bar belongs, specify the SideBySideStackedBarSeriesView.StackedGroup for each generated series. Handle the BoundDataChanged event to access the collection of these series.
using System;
using System.Data;
using System.Windows.Forms;
using DevExpress.XtraCharts;
// ...

namespace SideBySideStackedBarChart {
    public partial class Form1 : Form {
        ChartControl chart;
        public Form1() {
            InitializeComponent();
        }

        private void Form1_Load(object sender, EventArgs e) {
            // Create a new chart.
            chart = new ChartControl();
            chart.Dock = DockStyle.Fill;
            this.Controls.Add(chart);

            // Bind the chart to a data source.
            // Specify data members that the series template uses to
            // obtain series names, arguments, and values.
            chart.DataSource = GetChartData();
            chart.SeriesTemplate.SeriesDataMember = "Month";
            chart.SeriesTemplate.ArgumentDataMember = "Section";
            chart.SeriesTemplate.ValueDataMembers.AddRange(new string[] { "Value" });

            // Assign the Side-by-Side Stacked Bar series view to generated series.
            SideBySideStackedBarSeriesView view = new SideBySideStackedBarSeriesView();
            chart.SeriesTemplate.View = view;
            view.BarWidth = 0.6;

            //Enable point labels and format their text.
            chart.SeriesTemplate.LabelsVisibility = DevExpress.Utils.DefaultBoolean.True;
            chart.SeriesTemplate.Label.TextPattern = "{V}";

            // Customize axes.
            XYDiagram diagram = chart.Diagram as XYDiagram;
            diagram.AxisX.Tickmarks.MinorVisible = false;
            diagram.AxisY.WholeRange.AlwaysShowZeroLevel = false;

            chart.BoundDataChanged += Chart_BoundDataChanged;
        }

        private void Chart_BoundDataChanged(object sender, EventArgs e) {
            foreach (Series series in chart.Series) {
                if (series.Points.Count > 0) {
                    DataRowView row = series.Points[0].Tag as DataRowView;
                    ((ISupportStackedGroup)series.View).StackedGroup = row["Group"];
                }
            }
        }

        public DataTable GetChartData() {
            DataTable table = new DataTable();
            table.Columns.Add("Month", typeof(string));
            table.Columns.Add("Section", typeof(string));
            table.Columns.Add("Value", typeof(int));
            table.Columns.Add("Group", typeof(int));

            table.Rows.Add(new object[] { "January", "Section1", 10, 1 });
            table.Rows.Add(new object[] { "January", "Section2", 20, 1 });
            table.Rows.Add(new object[] { "February", "Section1", 20, 1 });
            table.Rows.Add(new object[] { "February", "Section2", 30, 2 });
            table.Rows.Add(new object[] { "March", "Section1", 15, 2 });
            table.Rows.Add(new object[] { "March", "Section2", 25, 1 });
            return table;
        }
    }
}