Chart Wizard Overview
- 2 minutes to read
Important
This documentation topic describes legacy functionality. We no longer develop new features for the Chart Wizard and suggest that you use the Chart Designer instead. Read the WinForms Charting - New Designer blog post for more information.
This document briefly describes how the Chart Wizard can be invoked, and briefly explains its structure.
By default, the Chart Wizard is automatically invoked after the ChartControl is dropped onto a form (or, the WebChartControl - onto an ASPx page). It is invoked whenever the “Display a wizard every time a new chart is added” check box at the bottom of the Wizard is enabled.
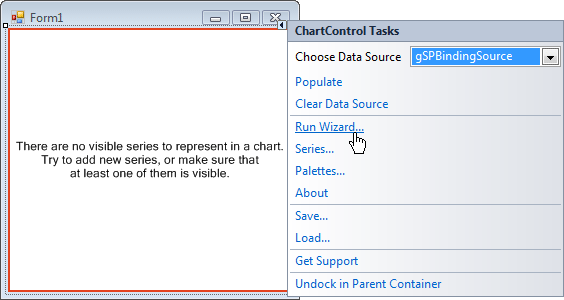
Also, you can quickly invoke it using the ChartControl’s smart tag, by clicking the Run Wizard… link.
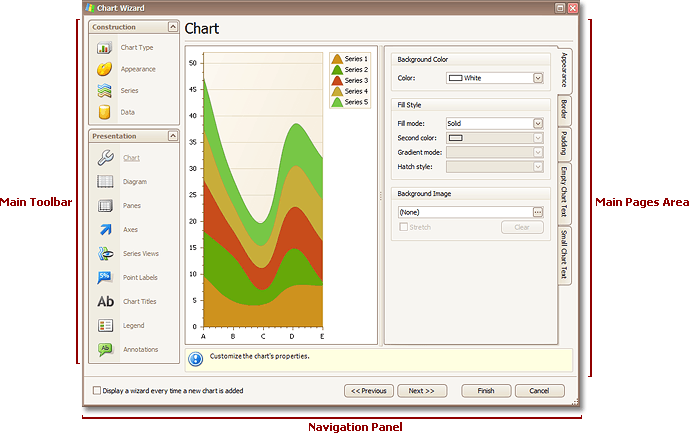
The Wizard is organized in two main areas: the toolbar on the left (which lists pages, that in turn, are organized in two groups: Construction and Presentation), and the main pages area, where all the options are represented by tabs, and where the real-time chart’s preview is situated. And, the panel at the bottom provides quick navigation through the Wizard’s pages.
If your chart is supposed to obtain data from a dataset (the most common case), before you run the Wizard, you should assign that data source’s name to the ChartControl.DataSource property, to be able to adjust all data-specific settings using the Wizard.
And, with XtraCharts, you have the freedom to completely customize and localize the Chart Wizard. For more information on this, refer to Chart Wizard for End-Users.