Basic Terms: Diagram
- 2 minutes to read
This topic provides general information about a chart’s diagram, and the types available.
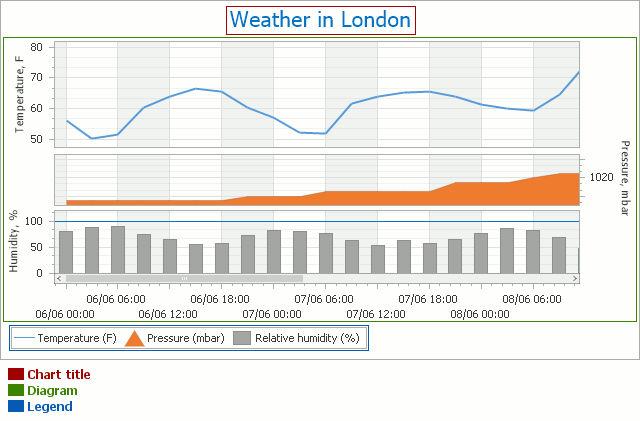
A diagram is a chart’s main area, where most of its data and graphical elements are displayed (e.g. series, axes and panes), even although some of these elements do not actually belong to a Diagram object (such as Series). For a complete list of chart elements, refer to Chart Elements.
A single chart control instance can only possess one diagram object. Its particular type is auto-determined by the view type of the first visible series in the chart’s collection. Each diagram type has a special set of options, and is used to plot series of a compatible view type only. For a complete list of the available diagram types with each type’s description, refer to Diagram.
At design time, a diagram’s options can be accessed via the ChartControl.Diagram property.
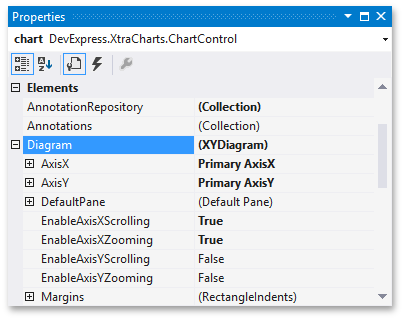
At runtime, to access a diagram’s properties, it’s required to cast your instance of a Diagram object to a specific type, as the following example demonstrates.
XYDiagram diagram = chart.Diagram as XYDiagram;
if (diagram != null) {
    diagram.Rotated = true;
    diagram.EnableAxisXScrolling = true;
}
For most diagram types, you can provide your end-users with the capability to scroll and zoom the diagram. For details on this, refer to Zooming and Scrolling (2D XY-Charts) and Zooming and Scrolling (3D Charts).
Among the most common diagram types is the XYDiagram2D, which employs two axes to plot series, and supports multiple panes, in which separate series can be distributed. These are explained in the next topic of this section: Understanding Axes and Panes.
For more information on using a diagram, refer to Diagram.