Basic Terms: Series and Series Views
- 2 minutes to read
This topic provides general information about a chart’s series, and their available view types.
A series is a collection of data points, which is not displayed until at least one point is specified. For example, the following image demonstrates three bar series series, and the underlying data they represent.

Series reside in the ChartControl.Series collection. Until there is at least one visible series in it, the chart and the chart’s diagram are empty. To learn about the ways in which series can be created, refer to the Create a Series Manually topic.
The WinForms Chart Control supports numerous chart types (some of which are shown in the following image). The view type determines both a series’ specific image, and the available set of options. For a list of available series view types, refer to the Series Views topic.
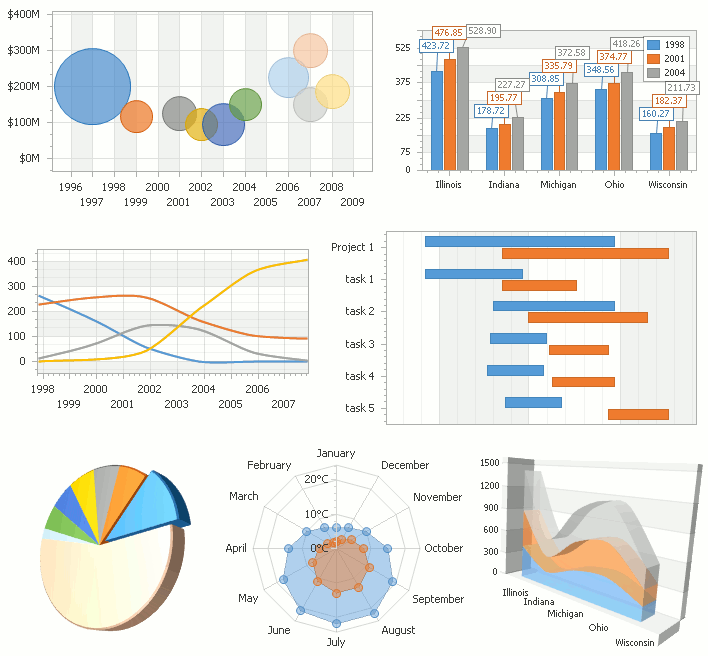
The view type of the first visible series in a chart’s collection determines the chart’s diagram type, meaning that all other series should have a compatible view type, so that they can be plotted together in the same chart control. For information on series compatibility, refer to the Series Views Compatibility topic.
The following image illustrates how a similar set of series views appears in charts with different diagram types (XY-Diagram and XY-Diagram 3D).
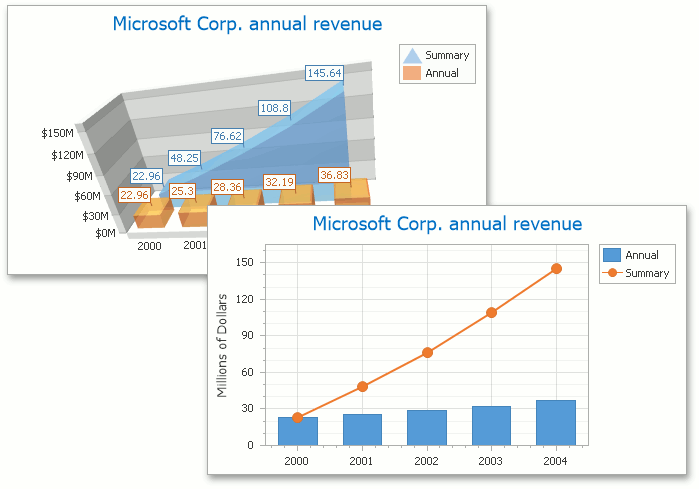
For more information, refer to Series Views.