Understanding a Data Point, Its Argument and Its Value
- 2 minutes to read
This topic provides general information about a chart’s data point, and explains its argument and value(s).
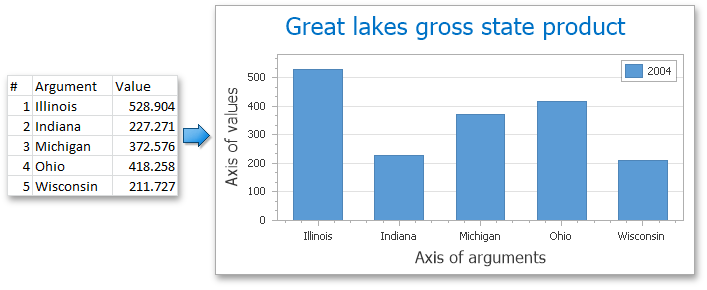
A chart’s most fundamental element is the data point. A group of data points represents a single series. Points reside in the Series.Points collection, and no series is displayed until it has at least one data point specified.
Because the WinForms Chart Control supports numerous series view types, which represent and organize data in different ways, the visual representation of a data point differs from one view to another. For details on this, refer to the Understanding Series and Series Views.
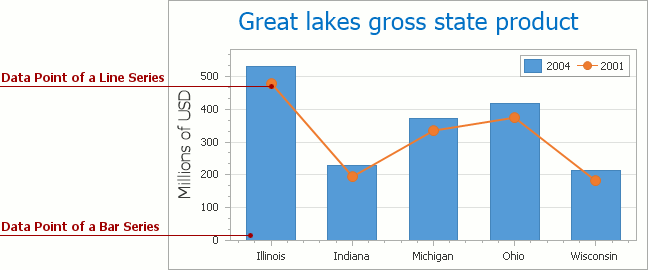
Each data point must have one argument and at least one value that corresponds to it. In general, the pairing of an argument and its value is represented on a diagram’s axes as their X and Y coordinates, respectively, as illustrated in the following image.
Additional values are required by certain view types (e.g., Financial and Bubble series). They are visually represented differently, depending on the view type.
A chart’s Legend helps you identify different chart elements such as series, constant line, and strips. In some situations, the chart’s legend can display distinct data points, which belong to the same series, rather than the name of the series itself.
To learn about the ways data points can be created, refer to Manually Add Points to a Series.
For more information, refer to Series Points.