How to: Avoid Overlapping of Series Labels
- 2 minutes to read
This tutorial explains how overlap resolving can be applied to series labels.
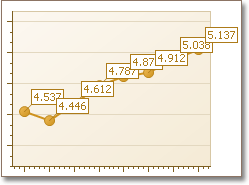
When series point labels are numerous and lengthy, they may overlap, making a chart crowded, and its data unreadable. Shown below is the appearance of a Line series, whose points are too close to each other, so that their labels overlap.
XtraCharts can help to avoid this, by applying an overlap resolving algorithm to series labels. Then, label overlap is auto-detected, and based on a chosen algorithm, either hides the overlapped labels, or distributes labels to avoid overlap. This functionality is available for both 2D and 3D chart types.
Note
The available modes differ from one series view type to another, and in this example we’ll use the most popular Line view type. To learn which options are available for each view type, refer to Series Point Labels.
To enable overlap detection, simply set the SeriesLabelBase.ResolveOverlappingMode property to a value other than None. The set of modes that are available for this property depend on the view type of the series. For the Line series, the following options are available:
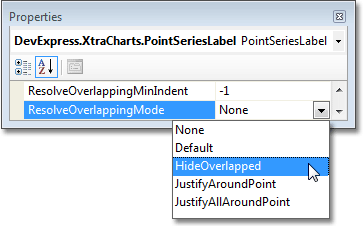
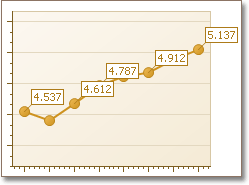
For example, set the SeriesLabelBase.ResolveOverlappingMode property to HideOverlapped, to get the following result.
For information on the availability of specific overlap resolving modes for every chart type, refer to the corresponding section of the Series Point Labels document.
In addition, you can specify the minimum indent which should be preserved between adjacent series labels, via the SeriesLabelBase.ResolveOverlappingMinIndent property.
Tip
A complete sample project is available in the DevExpress Code Examples database at http://www.devexpress.com/example=E1273.