Empty Points
- 10 minutes to read
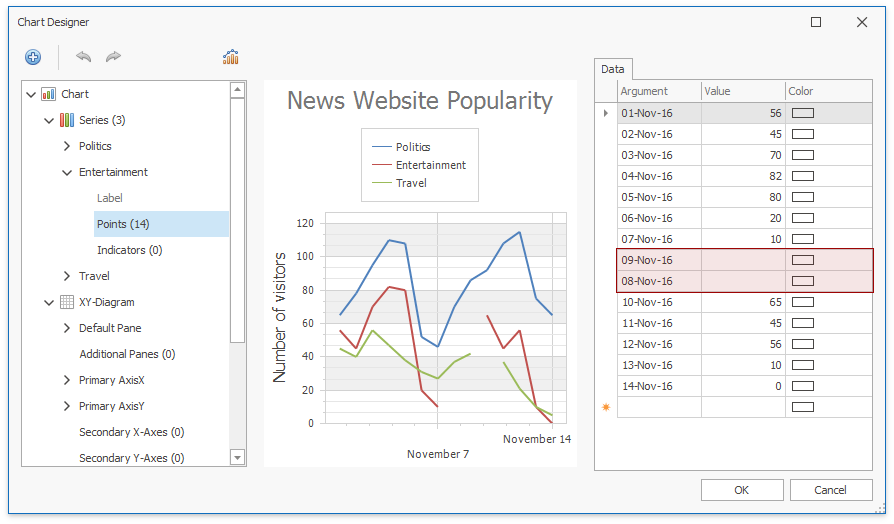
Empty points are points with undefined Values. This document describes how the Chart Control processes empty points.
The Chart displays empty points as breaks in the Line or Area series views, and missing points or bars in other series view types.
](/WindowsForms/images/chart-control/empty-points-line.png?v=21.2)
](/WindowsForms/images/chart-control/empty-points-spline-area.png?v=21.2)
](/WindowsForms/images/chart-control/empty-points-stepline3d.png?v=21.2)
](/WindowsForms/images/chart-control/empty-points-bars.png?v=21.2)
](/WindowsForms/images/chart-control/empty-points-points.png?v=21.2)
The following table contains data for the charts above:
| Date | Politics | Entertainment | Travel |
|---|---|---|---|
| 01-Nov-16 | 65 | 56 | 45 |
| 02-Nov-16 | 78 | 45 | 40 |
| 03-Nov-16 | 95 | 70 | 56 |
| 04-Nov-16 | 110 | 82 | 47 |
| 05-Nov-16 | 108 | 80 | 38 |
| 06-Nov-16 | 52 | 20 | 31 |
| 07-Nov-16 | 46 | 10 | 27 |
| 08-Nov-16 | 70 | 27 | |
| 09-Nov-16 | 86 | 42 | |
| 10-Nov-16 | 92 | 65 | |
| 11-Nov-16 | 108 | 45 | 37 |
| 12-Nov-16 | 115 | 56 | 21 |
| 13-Nov-16 | 75 | 10 | 10 |
| 14-Nov-16 | 65 | 0 | 5 |
To create an empty point, execute one of the following actions:
Leave a point’s value blank if you use the Chart Designer to add points to a series.
Use the SeriesPoint‘s class constructors that take only an argument as a parameter if you add points to a series in code.
using DevExpress.XtraCharts; using System; using System.Collections.Generic; using System.Windows.Forms; namespace EmptyPointRepresentation { public partial class Form1 : Form { ChartControl chart { get { return chartControl1; } } public Form1() { InitializeComponent(); Series series = new Series(); // The following line adds an empty series point to a series. series.Points.Add(new SeriesPoint(new DateTime(2019,1,1))); chart.Series.Add(series); } } }Set a data point’s value to Double.NaN in a data source.
using DevExpress.XtraCharts;
using System;
using System.Collections.Generic;
using System.Windows.Forms;

namespace EmptyPointRepresentation {
    public partial class Form1 : Form {
        ChartControl chart { get { return chartControl1; } }
        public Form1() {
            InitializeComponent();
        }
        private void OnFormLoad(object sender, EventArgs e) {
            chart.DataSource = DataPoint.GetPoints();
            Series series1 = new Series("Politics", ViewType.Line);
            series1.SetDataMembers("Date", "Politics");
            Series series2 = new Series("Entertainment", ViewType.Line);
            series2.SetDataMembers("Date", "Entertainment");
            Series series3 = new Series("Travel", ViewType.Line);
            series3.SetDataMembers("Date", "Travel");
            chart.Series.AddRange(new Series[] { series1, series2, series3 });
        }
    }
    public class DataPoint {
        public DateTime Date { get; set; }
        public Double Politics { get; set; }
        public Double Entertainment { get; set; }
        public Double Travel { get; set; }
        public static List<DataPoint> GetPoints() {
            return new List<DataPoint> {
                    new DataPoint { Date = new DateTime(2016,11,1), Politics = 65,   Entertainment = 56, Travel = 45 },
                    new DataPoint { Date = new DateTime(2016,11,2), Politics = 78,   Entertainment = 45, Travel = 40 },
                    new DataPoint { Date = new DateTime(2016,11,3), Politics = 95,   Entertainment = 70, Travel = 56 },
                    new DataPoint { Date = new DateTime(2016,11,4), Politics = 110,  Entertainment = 82, Travel = 47 },
                    new DataPoint { Date = new DateTime(2016,11,5), Politics = 108,  Entertainment = 80, Travel = 38 },
                    new DataPoint { Date = new DateTime(2016,11,6), Politics = 52,   Entertainment = 20, Travel = 31 },
                    new DataPoint { Date = new DateTime(2016,11,7), Politics = 46,   Entertainment = 10, Travel = 27 },
                    new DataPoint { Date = new DateTime(2016,11,8), Politics = 70,   Entertainment = Double.NaN, Travel = 27 },
                    new DataPoint { Date = new DateTime(2016,11,9), Politics = 86,   Entertainment = Double.NaN, Travel = 42 },
                    new DataPoint { Date = new DateTime(2016,11,10), Politics = 92,  Entertainment = 65, Travel = Double.NaN},
                    new DataPoint { Date = new DateTime(2016,11,11), Politics = 105, Entertainment = 45, Travel = 37 },
                    new DataPoint { Date = new DateTime(2016,11,12), Politics = 115, Entertainment = 56, Travel = 21 },
                    new DataPoint { Date = new DateTime(2016,11,13), Politics = 75,  Entertainment = 10, Travel = 10 },
                    new DataPoint { Date = new DateTime(2016,11,14), Politics = 65,  Entertainment = 0 , Travel = 5  }
                };
        }
    }
}
You can use the SeriesPoint.IsEmpty property to check whether a point is empty.
Tip
- You can use scale breaks to hide specific data ranges from an axis.
- To limit data displayed in a chart, configure visual and whole axis ranges.
- If you use an argument axis with a date-time scale, you can exclude holidays, weekends, or specified hours from a scale. Refer to the following help topic for more information: Work Time and Workday Configuration.
Define How to Handle Empty Points
Use a series view’s EmptyPointOptions property to access empty point settings. Specify the EmptyPointOptions.ProcessPoints property to select the manner in which the chart control should handle empty points.
For example, use the following code to display points with predicted values instead of empty points.
using DevExpress.XtraCharts;

    public Form1() {
        InitializeComponent();
        //...
        BarSeriesView view = (BarSeriesView)series.View;
        EmptyPointOptions emptyPointOptions = view.EmptyPointOptions;
        emptyPointOptions.ProcessPoints = ProcessEmptyPointsMode.Interpolate;
    }
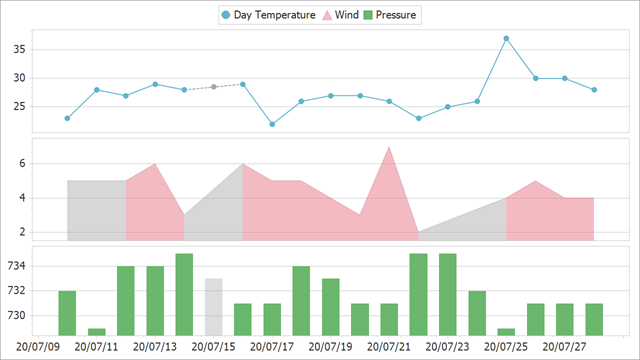
Customize Appearance of Empty Points
Appearance settings of empty points depends on the series view type. Depending on the view, cast the EmptyPointOptions property value to one of the following classes and configure empty point appearance settings:
- EmptyPointOptions – Contains common empty point settings and can be used for all series views.
- LineEmptyPointOptions – Contains settings specific to line series views (for example, LineStyle).
- AreaEmptyPointOptions – Contains settings specific to area series views (for example, FillStyle).
The example below configures empty point appearance for line, area, and bar series views. Empty points are painted gray:
LineSeriesView view1 = (LineSeriesView)series1.View;
view1.MarkerVisibility = DevExpress.Utils.DefaultBoolean.True;
LineEmptyPointOptions lineEmptyPointOptions = view1.EmptyPointOptions;
lineEmptyPointOptions.ProcessPoints = ProcessEmptyPointsMode.Interpolate;
lineEmptyPointOptions.Color = Color.DarkGray;
lineEmptyPointOptions.LineStyle.DashStyle = DashStyle.Dash;
lineEmptyPointOptions.LineStyle.Thickness = 2;

AreaSeriesView view2 = (AreaSeriesView)series2.View;
AreaEmptyPointOptions areaEmptyPointOptions = view2.EmptyPointOptions;
areaEmptyPointOptions.ProcessPoints = ProcessEmptyPointsMode.Interpolate;
areaEmptyPointOptions.FillStyle.FillMode = FillMode.Solid;
areaEmptyPointOptions.Color = Color.DarkGray;
areaEmptyPointOptions.Border.Color = Color.Gray;
areaEmptyPointOptions.Border.Thickness = 2;

SideBySideBarSeriesView view3 = (SideBySideBarSeriesView)series3.View;
EmptyPointOptions emptyPointOptions = view3.EmptyPointOptions;
emptyPointOptions.ProcessPoints = ProcessEmptyPointsMode.Interpolate;
emptyPointOptions.Color = Color.FromArgb(100, Color.DarkGray);
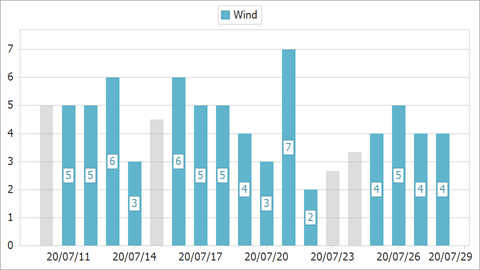
Show Isolated Points
The Chart does not draw a point between two empty points. To display a point in this case, enable the ShowIsolatedPoints property.
| ShowIsolatedPoints = true | ShowIsolatedPoints = false |
|---|---|
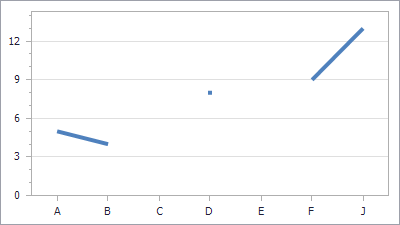 |
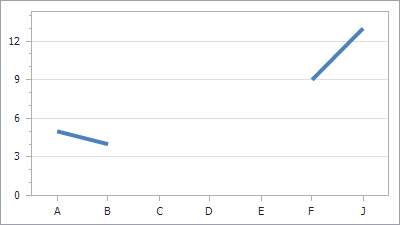 |
LineSeriesView view = chart.Series[0].View as LineSeriesView;
view.ShowIsolatedPoints = true;
Empty Points Specifics
- The Chart Control does not display series labels, tooltips, and the crosshair cursor label for empty points.
- If a data source contains missing records in arguments, data points are not created. Set the ScaleOptionsBase.ProcessMissingPoints property to
InsertEmptyPointsto handle missing points as empty points. Empty points are ignored when you aggregate Chart’s data and the chart contains data next to empty points within the specified interval of the measurement unit.
For example, the following list of data points is used as a chart data source:
    public static List<DataPoint> GetPoints() {
        return new List<DataPoint> {
            new DataPoint { Date = new DateTime(2016,11,1), Politics = 65,   Entertainment = 56 },
            new DataPoint { Date = new DateTime(2016,11,2), Politics = 78,   Entertainment = 45 },
            new DataPoint { Date = new DateTime(2016,11,3), Politics = 95,   Entertainment = 70 },
            new DataPoint { Date = new DateTime(2016,11,4), Politics = 110,  Entertainment = 82 },
            new DataPoint { Date = new DateTime(2016,11,5), Politics = 108,  Entertainment = 80 },
            new DataPoint { Date = new DateTime(2016,10,6), Politics = 52,   Entertainment = 20 },
            new DataPoint { Date = new DateTime(2016,10,7), Politics = 46,   Entertainment = 10 },
            new DataPoint { Date = new DateTime(2016,12,8), Politics = 70,   Entertainment = Double.NaN },
            new DataPoint { Date = new DateTime(2017,05,9), Politics = 86,   Entertainment = Double.NaN },
            new DataPoint { Date = new DateTime(2017,05,10), Politics = 92,  Entertainment = 65 },
            new DataPoint { Date = new DateTime(2017,05,11), Politics = 105, Entertainment = 45 },
            new DataPoint { Date = new DateTime(2017,12,12), Politics = 115, Entertainment = 56 },
            new DataPoint { Date = new DateTime(2017,12,13), Politics = 75,  Entertainment = 10 },
            new DataPoint { Date = new DateTime(2017,12,14), Politics = 65,  Entertainment = 0 }
        };
    }
The chart below aggregates the data for the Entertainment and Politics series by month. The Entertainment series contains two empty points that are displayed differently - the series line does not break for “May 2017” despite the existing empty point, while “December 2016” is displayed as a break:
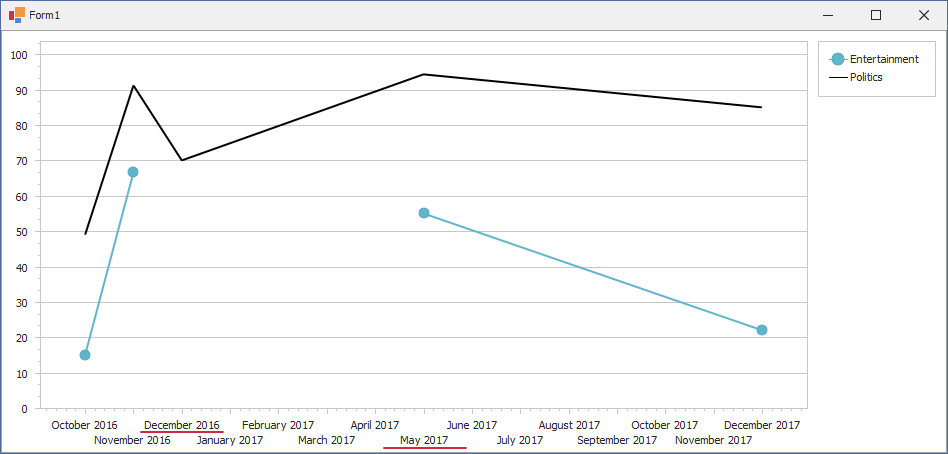
The difference between the display of two intervals with empty points is that “December 2016” contains no data except an empty point, and “May 2017” contains several points in addition to an empty point.