How to: Bind a Chart to an XPO Data Source
- 3 minutes to read
This tutorial demonstrates how a chart can be bound to an eXpress Persistent Objects (XPO) data source. XPO is a DevExpress technology that gives you the freedom to build true business objects without having to deal with the tedious complexities of mapping them onto database tables. eXpress Persistent Objects for .NET completely abstracts the database layer from the developer, leaving him or her fully in the object-oriented realm. With XPO, you can build applications that are compatible with multiple database systems (currently supported are: MS Access, MS SQL Server, MySQL, Oracle, PostgreSql, Firebird, PervasiveSQL, VistaDB, SQL Anywhere, Advantage, DB2 and Sybase) without making ANY changes to your code. For more information, refer to eXpress Persistent Objects.
To bind a chart to an XPO data source, do the following.
- Start MS Visual Studio (2008 or 2010), and create a new Windows Forms Application, or open an existing one.
- Add a chart to the form.
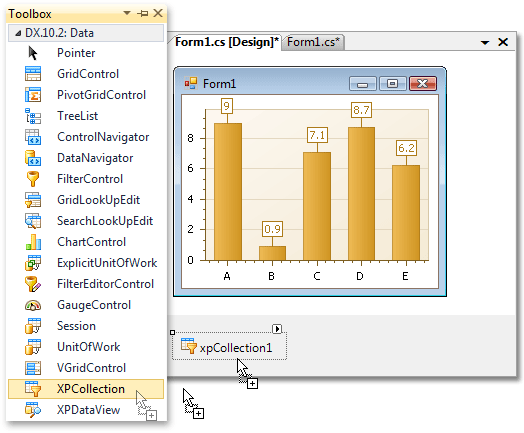
From the DX.20.2: Data toolbox tab, drop the XPCollection component onto the form.
Now, switch from the design view of the form to its code, and declare the XPObject class descendant. For example, use the following code.
To populate the data source, handle the Form1_Load event using the following code.
- Rebuild the application so that this object can be used for the XPCollection.
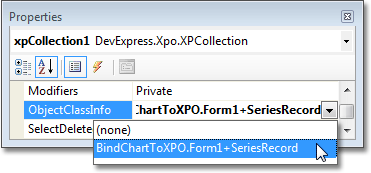
Set the ObjectClassInfo property of the XPCollection object to the SeriesRecord object.
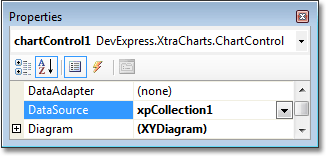
Now, set the ChartControl.DataSource property to this XPCollection object.
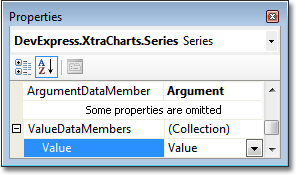
And, define where the chart’s series should obtain data for its points’ arguments and their values, set the SeriesBase.ArgumentDataMember property to Argument, and the SeriesBase.ValueDataMembers property to Value.
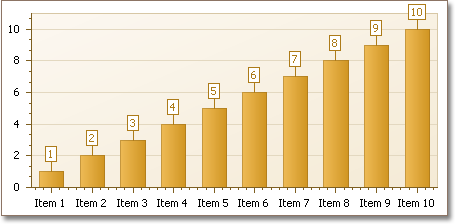
The chart is now bound to the XPO data source, and the result is shown in the following image.
Tip
A complete sample project is available in the DevExpress Code Examples database at https://supportcenter.devexpress.com/ticket/details/e1576/how-to-bind-a-chart-to-xpo.