Specify Series Data Members
- 3 minutes to read
This document describes how to specify a data source for a manually created series, and populate series points automatically based on the data source table. This is an alternative approach to manually adding series points.
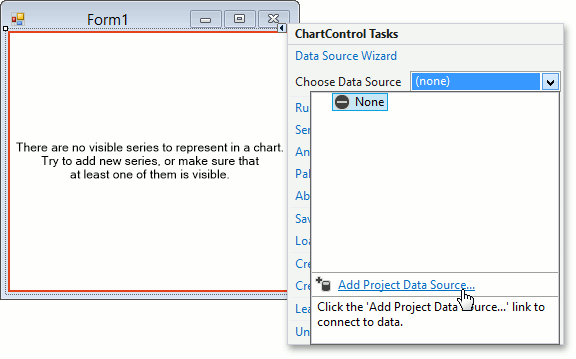
After you manually create a series, it is not displayed unless it has points. Thus, you can force series to obtain their data from your project’s data source.
To add a project data source, click the chart’s smart tag. In its actions list, expand the Choose Data Source drop-down list and select Add Project Data Source….
Next, proceed to steps 6-11 of How to: Bind Individual Chart Series to Data. After you have finished connecting to the data, make sure that appropriate values are assigned to the chart’s ChartControl.DataSource.
Since each series point is defined by both an argument and its corresponding value (and, some series view types require multiple values for each argument), you should specify an appropriate argument data member and value data member(s).
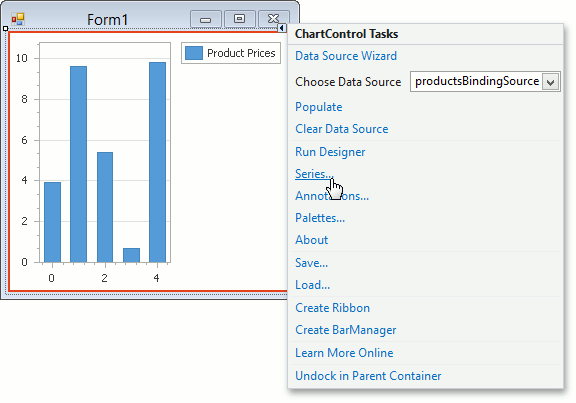
To quickly access these properties, click the chart’s smart tag, and choose Series… in its actions list.
Then, in the invoked Series Collection Editor, select a series and switch to the Properties tab. In this tab, specify the SeriesBase.ArgumentDataMember and SeriesBase.ValueDataMembers properties.
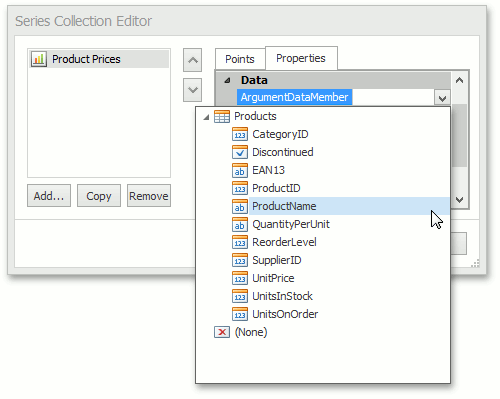
Note that if a series uses the chart control’s data source, it is not necessary to define the Series.DataSource property. It should only be specified when series use separate data sources different from that of the chart control.
Now, points will be created and populated automatically, as long as there are records (rows) in the specified data columns.
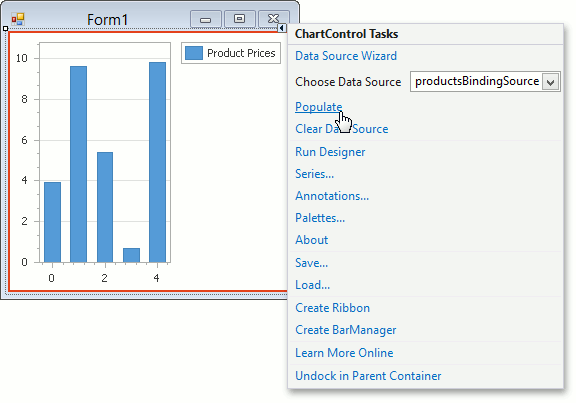
Note that at design time, the chart displays mock points for series, to use PC resources more efficiently. To force the loading of real data, click Populate in the chart’s actions list.
To learn about the most important series options, refer to Series.
More Examples
- How to: Bind Individual Chart Series to Data at Run Time
- This tutorial explains how to bind each chart series to an individual data source in code.
- How to: Bind Individual Chart Series to Data at Design Time
- This tutorial explains how to bind each chart series to an individual data source at design time.
- How to: Bind Chart Series to Data in the Data Source Wizard
- This tutorial describes how to bind a chart to an external data source in the Data Source Configuration Wizard.