How to: Add a Fibonacci Indicator to a Chart
- 2 minutes to read
This tutorial demonstrates a way of showing a Fibonacci indicator for a series. For general information, see Fibonacci Indicators.
To show a Fibonacci indicator for a Stock chart, do the following.
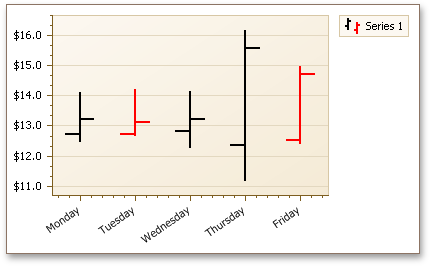
Create a new or open an existing Stock chart. For this example, we will use the following chart.
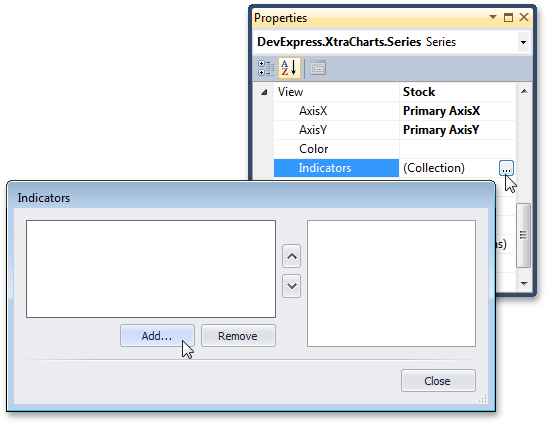
Select the series in the Property Grid, expand its SeriesBase.View property and click the ellipsis button for the XYDiagram2DSeriesViewBase.Indicators property.
In the invoked Indicators dialog, click the Add… button.
Then, in the Indicator Type dialog, choose the required Fibonacci indicator kind and click OK.
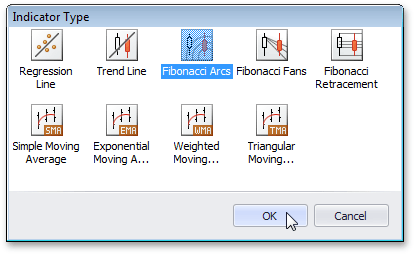
If required, you can change the kind later, via the FibonacciIndicator.Kind property.
Now, back in the Indicators dialog, define the arguments and values for the FinancialIndicator.Point1 and FinancialIndicator.Point2 properties, and adjust other options of the indicator.
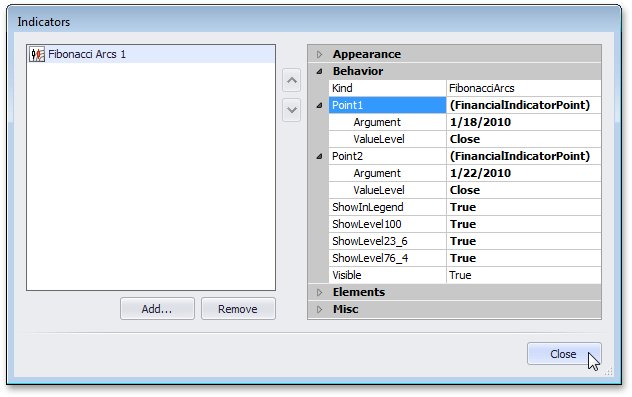
For each kind of Fibonacci indicator, it is possible to display extra lines for the additional levels implied by the Fibonacci sequence. The set of these levels is unique for each kind.
The following image demonstrates the resulting Fibonacci Arcs indicator.
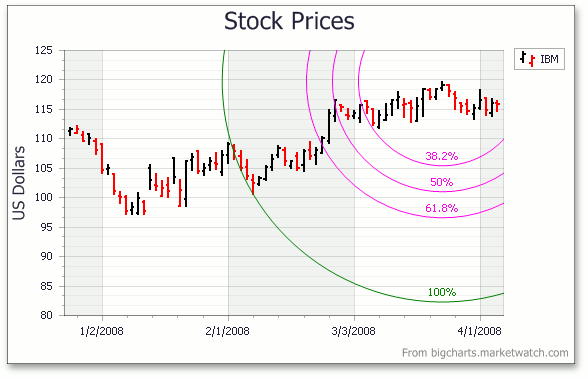
Note that as with other indicators, all Fibonacci indicators that exist in a chart are painted based on the palette defined via the ChartControl.IndicatorsPaletteName property.
Tip
A complete sample project is available in the DevExpress Code Examples database at https://supportcenter.devexpress.com/ticket/details/e966/how-to-draw-fibonacci-arcs-fans-and-retracement-for-a-stock-series.