How to: Individually Change the View Type of Automatically Created Series
- 4 minutes to read
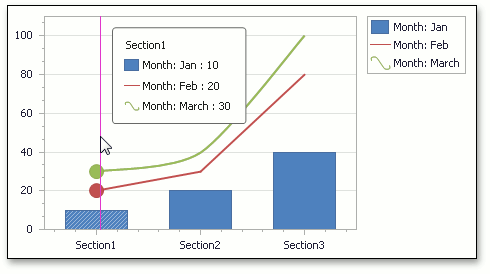
This example demonstrates how an auto-created series (a series generated automatically based on the series template settings) can be accessed at runtime, to individually change its view type.
This is performed in a special ChartControl.BoundDataChanged event of the chart control.
using System;
using System.Data;
using System.Windows.Forms;
using DevExpress.XtraCharts;
// ...

namespace ChangeViewOfAnAutoSeries {
    public partial class Form1 : Form {
        public Form1() {
            InitializeComponent();
        }

        private DataTable CreateChartData() {
            // Create an empty table.
            DataTable table = new DataTable("Table1");

            // Add three columns to the table.
            table.Columns.Add("Month", typeof(String));
            table.Columns.Add("Section", typeof(String));
            table.Columns.Add("Value", typeof(Int32));

            // Add data rows to the table.
            table.Rows.Add(new object[] { "Jan", "Section1", 10 });
            table.Rows.Add(new object[] { "Jan", "Section2", 20 });
            table.Rows.Add(new object[] { "Jan", "Section3", 40 });
            table.Rows.Add(new object[] { "Feb", "Section1", 20 });
            table.Rows.Add(new object[] { "Feb", "Section2", 30 });
            table.Rows.Add(new object[] { "Feb", "Section3", 80 });
            table.Rows.Add(new object[] { "March", "Section1", 30 });
            table.Rows.Add(new object[] { "March", "Section2", 40 });
            table.Rows.Add(new object[] { "March", "Section3", 100 });

            return table;
        }

        private void Form1_Load(object sender, EventArgs e) {
            // Create a chart.
            ChartControl chart = new ChartControl();

            // Generate a data table and bind the chart to it.
            chart.DataSource = CreateChartData();

            // Specify data members to bind the chart's series template.
            chart.SeriesDataMember = "Month";
            chart.SeriesTemplate.ArgumentDataMember = "Section";
            chart.SeriesTemplate.ValueDataMembers.AddRange(new string[] { "Value" });

            // Specify the template's series view.
            chart.SeriesTemplate.View = new SideBySideBarSeriesView();

            // Specify the BoundDataChanged event handler.
            chart.BoundDataChanged +=
                new BoundDataChangedEventHandler(chart_BoundDataChanged);

            // Specify the template's name prefix.
            chart.SeriesNameTemplate.BeginText = "Month: ";

            // Dock the chart into its parent, and add it to the current form.
            chart.Dock = DockStyle.Fill;
            this.Controls.Add(chart);
        }

        private void chart_BoundDataChanged(object sender, EventArgs e) {
            ChartControl chart = (ChartControl)sender;

            // Change the view of the "Month: Feb" series from
            // SideBySideBarSeriesView to LineSeriesView.
            Series feb = chart.GetSeriesByName("Month: Feb");
            if (feb != null)
                feb.ChangeView(ViewType.Line);

            // Change the view of the "Month: March" series from
            // SideBySideBarSeriesView to SplineSeriesView.
            Series march = chart.GetSeriesByName("Month: March");
            if (march != null)
                march.ChangeView(ViewType.Spline);
        }
    }
}
The result is shown in the following image.
See Also