How to: Change the Display Format for Axis Labels (Runtime Sample)
- 3 minutes to read
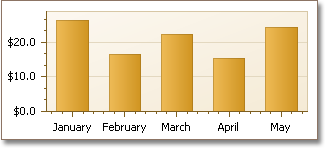
This example demonstrates how you can customize the numerical and date-time options of an axis.
using System;
using System.Windows.Forms;
using DevExpress.XtraCharts;
// ...

namespace FormatAxisLabels {
    public partial class Form1 : Form {
        public Form1() {
            InitializeComponent();
        }

        private void Form1_Load(object sender, EventArgs e) {
            // Create an empty chart.
            ChartControl chartControl1 = new ChartControl();

            // Create a bar series and add points to it.
            Series series1 = new Series("Series 1", ViewType.Bar);
            series1.Points.Add(new SeriesPoint(new DateTime(2009, 1, 1), new double[] { 26.25 }));
            series1.Points.Add(new SeriesPoint(new DateTime(2009, 2, 1), new double[] { 16.52 }));
            series1.Points.Add(new SeriesPoint(new DateTime(2009, 3, 1), new double[] { 22.21 }));
            series1.Points.Add(new SeriesPoint(new DateTime(2009, 4, 1), new double[] { 15.35 }));
            series1.Points.Add(new SeriesPoint(new DateTime(2009, 5, 1), new double[] { 24.15 }));

            // Add the series to the chart.
            chartControl1.Series.Add(series1);

            // Hide the legend (if necessary).
            chartControl1.Legend.Visibility = DevExpress.Utils.DefaultBoolean.False;

            // Set the scale type for the series' arguments and values.
            series1.ArgumentScaleType = ScaleType.DateTime;
            series1.ValueScaleType = ScaleType.Numerical;

            // Cast the chart's diagram to the XYDiagram type, to access its axes.
            XYDiagram diagram = chartControl1.Diagram as XYDiagram;

            // Define the date-time measurement unit, to which the beginning of
            // a diagram's gridlines and labels should be aligned.
            diagram.AxisX.DateTimeScaleOptions.GridAlignment = DateTimeGridAlignment.Day;

            // Define the detail level for date-time values.
            diagram.AxisX.DateTimeScaleOptions.MeasureUnit = DateTimeMeasureUnit.Month;

            // Define the custom date-time format (name of a month) for the axis labels.
            diagram.AxisX.Label.TextPattern = "{V:MMMM}";

            // Since the ValueScaleType of the chart's series is Numerical,
            // it is possible to customize the NumericOptions of Y-axis.
            diagram.AxisY.Label.TextPattern = "{V:C1}";

            // Add a title to the chart (if necessary).
            ChartTitle chartTitle1 = new ChartTitle();
            chartTitle1.Text = "Axis Scale Types";
            chartControl1.Titles.Add(chartTitle1);

            // Add the chart to the form.
            chartControl1.Dock = DockStyle.Fill;
            this.Controls.Add(chartControl1);
        }

    }
}
The result is shown in the following image.
See Also