Fibonacci Indicators
- 4 minutes to read
This document provides a general overview of Fibonacci indicators, and details each of the available types.
This document consists of the following sections.
Fibonacci Indicators Overview
Fibonacci indicators are tools that are primarily used in financial analysis, to forecast levels of support and resistance for a Stock price trend. However, with XtraCharts, you can use them not only with Stock and Candlestick charts, but for any 2D XY- or Gantt-series as well.
Referring to the Fibonacci sequence, these indicators are intended to expose the golden ratio symmetry between two given series points (FinancialIndicator.Point1 and FinancialIndicator.Point2) in different visual forms, depending on the kind of an indicator.
Each point’s coordinates are determined by its FinancialIndicatorPoint.Argument and FinancialIndicatorPoint.ValueLevel properties. So, for a Stock chart you can define the StockLevel.Low level for one point, and StockLevel.High for another (or, StockLevel.Open and StockLevel.Close ).
And, between these two extreme points (through which the base level lines pass), intermediate points are distributed (along with the corresponding additional levels), based on values suggested by the golden ratio.
The appearance of radius lines is individually adjusted for the base (FibonacciIndicator.BaseLevelColor, FibonacciIndicator.BaseLevelLineStyle and FibonacciIndicatorLabel.BaseLevelTextColor) and intermediate (Indicator.Color, Indicator.LineStyle and TitleBase.TextColor) levels. Common options of indicator labels are available via the FibonacciIndicator.Label property.
Note that all the chart’s indicators are painted, based on a palette defined via the ChartControl.IndicatorsPaletteName property.
A Fibonacci indicator is represented by the FibonacciIndicator class instance residing in the IndicatorCollection of a view, accessible via the XYDiagram2DSeriesViewBase.Indicators property. To learn how a Fibonacci indicator is added to the collection, refer to How to: Add a Fibonacci Indicator to a Chart.
Three kinds of Fibonacci indicators are provided by the FibonacciIndicator.Kind property:
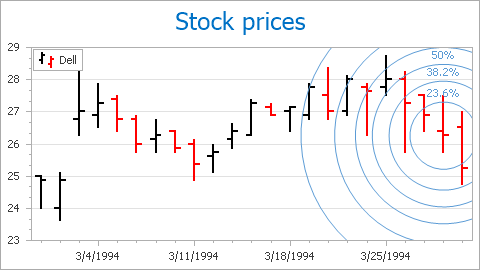
Fibonacci Arcs
The FibonacciIndicatorKind.FibonacciArcs kind is represented by concentric circles, whose center corresponds to a value level of FinancialIndicator.Point1. Along with the second point’s value level, they correspond to the 0% and 100% radii (the base levels), with intermediate radii suggested by the golden ratio (except for the 50% level).
An example of Fibonacci Arcs can be seen in the following image (the 100% level is shown).
You can choose which levels are shown, via the FibonacciIndicator.ShowLevel100, FibonacciIndicator.ShowLevel23_6 and FibonacciIndicator.ShowLevel76_4 properties.
Fibonacci Fans
The FibonacciIndicatorKind.FibonacciFans kind has the first point’s value level connected with a value level of another point by the base level line. This trend is taken for 0% from the same center (the first point’s value level), at angles suggested by the golden ratio, intermediate lines are drawn.
An example of the Fibonacci Fans can be seen in the following image (with the 0% level being shown).
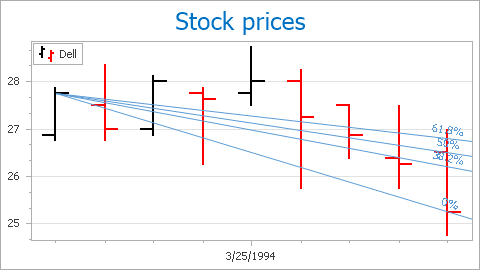
You can choose which levels should be shown, via the FibonacciIndicator.ShowLevel0, FibonacciIndicator.ShowLevel23_6 and FibonacciIndicator.ShowLevel76_4 properties.
Fibonacci Retracement
The FibonacciIndicatorKind.FibonacciRetracement kind takes a first point’s value level as 100%, and across this point a line is drawn. The other point’s value level taken is 0%, and its line is drawn in parallel to the first. The intermediate space is marked off by parallels, drawn where additional levels lie.
An example of the Fibonacci Retracement can be seen in the following image (with an additional 161.8% level being shown).
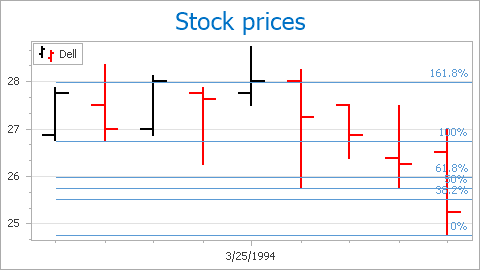
You can choose which levels should be shown, via the FibonacciIndicator.ShowLevel23_6 and FibonacciIndicator.ShowLevel76_4 properties. Plus, the FibonacciIndicator.ShowAdditionalLevels option can draw golden ratio levels beyond 100% (e.g. 161.8%, 261.8%, and so on), if they are allowed by the chart’s size.
For more elaborate information on Fibonacci indicators, with a detailed description of each type, visit our web site at Fibonacci indicators in financial charts and Fibonacci indicators online demo.