Trend Lines
- 3 minutes to read
This document provides a general overview of Trend Lines and describes how to draw a trend line between any two series points.
This document consists of the following sections.
Trend Lines Overview
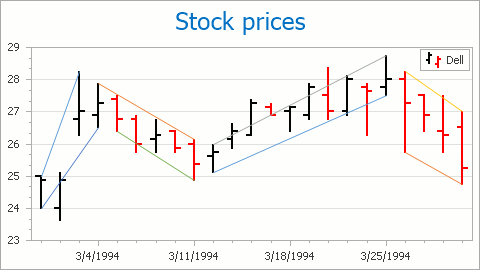
A Trend Line is a line drawn between any two points in a series, to show the general direction that values are headed towards. Trend Lines belong to the Indicators tool set provided by XtraCharts, for extended visual data analysis.
Trend Lines are often used in business analytics to show changes in data over time, using simple and understandable visuals. However, they suffer from a lack of scientific validity in cases where other potential changes can affect the data. For some scenarios it may be more appropriate to use Regression Lines, which are more sophisticated analytical instrument.
A Trend Line is represented by an instance of the TrendLine class, which is a descendant of the Indicator class. The Trend Line resides in the IndicatorCollection of a series, which is accessible via the XYDiagram2DSeriesViewBase.Indicators property.
The view type of the series to which a Trend Line is assigned is returned by the Indicator.View property.
A series can possess any number of Trend Lines, and it is possible to draw any number of these lines across the same series point.
Since a Trend Line must be drawn across two points, its two properties should be appropriately defined: FinancialIndicator.Point1 and FinancialIndicator.Point2. In turn, for each of these points you should define its argument (via the FinancialIndicatorPoint.Argument property) and value level (via the FinancialIndicatorPoint.ValueLevel property). For series view types supporting only a single value, the FinancialIndicatorPoint.ValueLevel property has the Value setting only.
The TrendLine.ExtrapolateToInfinity property indicates whether the current Trend Line should be extrapolated beyond the end point’s argument, or limited to this point.
A Trend Line’s appearance is managed via its Indicator.Color and Indicator.LineStyle properties.
Draw a Trend Line
To access the collection of indicators for a series at design time, select the series, and in the Properties window, expand its SeriesBase.View property, and click the ellipsis button for the XYDiagram2DSeriesViewBase.Indicators property.
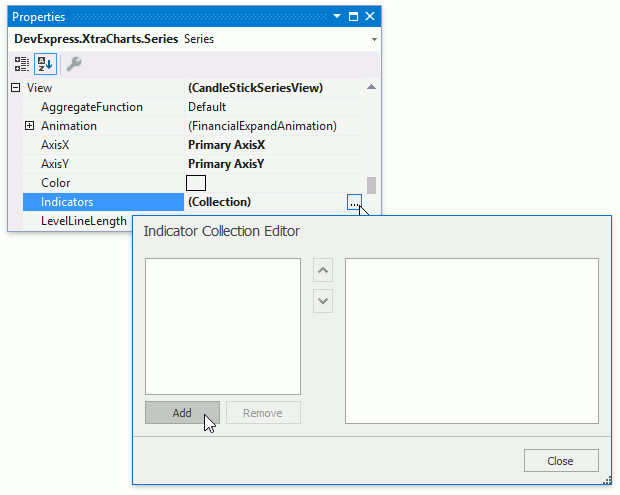
In the invoked Indicators dialog, click the Add… button, and in the invoked Indicator Type dialog, choose Trend Line, and click OK.
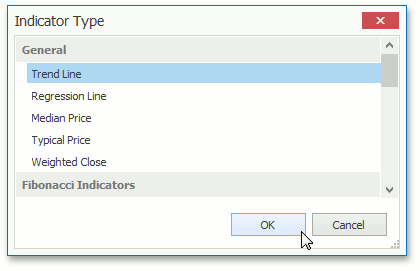
After a Trend Line is created, you can define its properties in the Indicators dialog: FinancialIndicator.Point1, FinancialIndicator.Point2 and other properties.
Note that all of the chart’s indicators are painted based on a palette defined via the ChartControl.IndicatorsPaletteName property.